
UNITED STATES
SECURITIES AND EXCHANGE COMMISSION
WASHINGTON, D.C. 20549
FORM 10-K
x ANNUAL REPORT PURSUANT TO SECTION 13 OR 15(d) OF
THE SECURITIES EXCHANGE ACT OF 1934
For the fiscal year ended December 31, 2019
¨ TRANSITION REPORT PURSUANT TO SECTION 13 OR 15(d) OF THE SECURITIES
EXCHANGE ACT OF 1934
For the transition period from ____________ to ____________
Commission File Number: 001-34767
CLARUS CORPORATION
(Exact name of registrant as specified in its charter)
| Delaware | 58-1972600 | |
|
(State or other jurisdiction of incorporation or organization) |
(I.R.S. Employer Identification Number) |
|
2084 East 3900 South Salt Lake City, Utah |
84124 | |
| (Address of principal executive offices) | (Zip code) |
| (801) 278-5552 |
| (Registrant’s telephone number, including area code) |
Securities registered pursuant to Section 12(b) of the Act:
| Title of each class | Name of each exchange on which registered |
| Common Stock, par value $.0001 per share | NASDAQ Global Select Market |
Securities registered pursuant to Section 12(g) of the Act:
None
(Title of class)
Indicate by check mark if the registrant is a well-known seasoned issuer, as defined in Rule 405 of the Securities Act. YES ¨ NO x
Indicate by check mark if the registrant is not required to file reports pursuant to Section 13 or Section 15(d) of the Exchange Act. YES ¨ NO x
Indicate by check mark whether the registrant: (1) has filed all reports required to be filed by Section 13 or 15(d) of the Securities Exchange Act of 1934 during the preceding 12 months (or for such shorter period that the Registrant was required to file such reports), and (2) has been subject to such filing requirements for the past 90 days. YES x NO ¨
Indicate by check mark whether the registrant has submitted electronically every Interactive Data File required to be submitted pursuant to Rule 405 of Regulation S-T (§232.405 of this chapter) during the preceding 12 months (or for such shorter period that the registrant was required to submit such files). YES x NO ¨
Indicate by check mark whether the registrant is a large accelerated filer, an accelerated filer, a non-accelerated filer, a smaller reporting company, or an emerging growth company. See the definitions of “large accelerated filer,” “accelerated filer,” “smaller reporting company,” and “emerging growth company” in Rule 12b-2 of the Exchange Act.
| Large accelerated filer | ¨ | Non-accelerated filer | ¨ | |
| Accelerated filer | x | Smaller reporting company | ¨ | |
| Emerging growth company | ¨ |
If an emerging growth company, indicate by check mark if the registrant has elected not to use the extended transition period for complying with any new or revised financial accounting standards provided pursuant to Section 13(a) of the Exchange Act. ¨
Indicate by check mark whether the registrant is a shell company (as defined in Rule 12b-2 of the Exchange Act) YES ¨ NO x
The aggregate market value of the voting stock and non-voting common equity held by non-affiliates of the Registrant at June 30, 2019 was approximately $336.9 million based on $14.44 per share, the closing price of the common stock as quoted on the NASDAQ Global Select Market.
As of March 4, 2020, there were 29,759,620 shares of common stock, par value $0.0001, outstanding.
DOCUMENT INCORPORATED BY REFERENCE
Portions of our Proxy Statement for the 2020 Annual Meeting of Stockholders to be filed with the Securities and Exchange Commission within 120 days of the Registrant’s 2019 fiscal year end are incorporated by reference into Part III of this Annual Report on Form 10-K.
INDEX
2
Overview
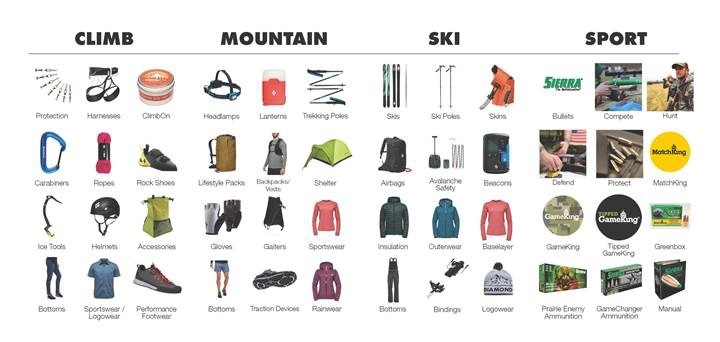
Headquartered in Salt Lake City, Utah, Clarus Corporation (which may be referred to as the “Company,” “Clarus,” “we,” “our” or “us”), a company focused on the outdoor and consumer industries, is seeking opportunities to acquire and grow businesses that can generate attractive shareholder returns. The Company has net operating tax loss carryforwards which it is seeking to redeploy to maximize shareholder value. Clarus’ primary business is as a leading designer, developer, manufacturer and distributor of outdoor equipment and lifestyle products focused on the climb, ski, mountain, sport and skincare markets. The Company’s products are principally sold under the Black Diamond®, Sierra®, PIEPS® and SKINourishment® brand names through outdoor specialty and online retailers, distributors and original equipment manufacturers throughout the U.S. and internationally.
Through our Black Diamond, PIEPS, and SKINourishment brands, we offer a broad range of products including: high-performance, activity-based apparel (such as shells, insulation, midlayers, pants and logowear); rock-climbing footwear and equipment (such as carabiners, protection devices, harnesses, belay devices, helmets, and ice-climbing gear); technical backpacks and high-end day packs; trekking poles; headlamps and lanterns; gloves and mittens; and skincare and other sport-enhancing products. We also offer advanced skis, ski poles, ski skins, and snow safety products, including avalanche airbag systems, avalanche transceivers, shovels, and probes. Through our Sierra brand, we manufacture a wide range of high-performance bullets and ammunition for both rifles and pistols that are used for precision target shooting, hunting and military and law enforcement purposes.
Clarus Corporation, incorporated in Delaware in 1991, acquired Black Diamond Equipment, Ltd. (“Black Diamond Equipment”) in May 2010 and changed its name to Black Diamond, Inc. in January 2011. In October 2012, we acquired PIEPS Holding GmbH and its subsidiaries (collectively, “PIEPS”).
On August 14, 2017, the Company changed its name from Black Diamond, Inc. to Clarus Corporation and its stock ticker symbol from “BDE” to “CLAR” on the NASDAQ stock exchange. On August 21, 2017, the Company acquired Sierra Bullets, L.L.C. (“Sierra”). On November 6, 2018, the Company acquired the assets of SKINourishment, Inc. (“SKINourishment”).
On May 7, 2018, the Company announced a “modified Dutch auction” tender offer for Clarus’ common stock, as well as the preferred share purchase rights associated with such shares (collectively, the “Shares”). On July 11, 2018, the tender offer expired, following which the Company announced it would accept 417,237 Shares for purchase at a price of $8.00 per Share, for an aggregate cost of approximately $3,338,000, excluding fees and expenses.
On August 6, 2018, the Company announced that its Board of Directors approved the initiation of a quarterly cash dividend program of $0.025 per share of the Company’s common stock (the “Quarterly Cash Dividend”) or $0.10 per share on an annualized basis. In 2019 and 2018, our total Quarterly Cash Dividends were $2,987,000 and $1,488,000, respectively. On January 24, 2020, the Company announced that its Board of Directors approved the payment on February 14, 2020 of the Quarterly Cash Dividend to the record holders of shares of the Company’s common stock as of the close of business on February 3, 2020.
Market Overview
Our primary target customers are outdoor-oriented consumers who enjoy active, outdoor-focused lifestyles. The users of our products are made up of a wide range of outdoor enthusiasts, including climbers, mountaineers, trail runners, skiers, mountain bikers, backpackers and campers, competitive shooters, hunters and other outdoor-inspired consumers. We believe we have a strong reputation for innovation, style, quality, design, safety, and durability in our core product lines.
As the variety of outdoor sports activities continue to grow and proliferate, and existing outdoor sports evolve and become ever more specialized, we believe other outdoor companies are failing to address the unique technical and performance needs of enthusiasts involved in such specialized activities. We believe we have been able to help address this void in the marketplace by seeking to leverage our user intimacy and improving on our existing product lines by expanding our product offerings into new niche categories and products, and by incorporating innovative industrial design and engineering and performance tolerances into our products. We believe the credibility and authenticity of our brands expands our potential market beyond committed outdoor athletes to those outdoor generalist consumers who desire to lead active, outdoor-focused lifestyles.
3
Growth Strategies
Our growth strategies are to achieve sustainable, profitable growth organically while seeking to expand our business through targeted, strategic acquisitions. We intend to create innovative new products, increase consumer and retailer awareness and demand for our products, and build stronger emotional brand connections with consumers over time across a growing number of geographic markets.
Continue to Service and Grow Existing Accounts. We continue to seek to develop strong relationships with our key retail, distributor and original equipment manufacturer (“OEM”) partners through a mutual respect and admiration for the sports we serve. Through our various corporate initiatives, a focus on being easy to do business with, the extension of our existing product portfolios, and an emphasis on quality, on-time deliveries, brand awareness and marketing, we plan to grow our existing accounts as well as foster new relationships.
Broaden Distribution Footprint. We believe there is a significant opportunity to expand the presence and penetration of each of our brands outside of the U.S. market. The European alpine market is currently significantly larger than the U.S. market and is highly fragmented by country, with no clear leader across Europe. We have been able to gain market share by emphasizing our Black Diamond brand, positioning it as a global brand with American roots and PIEPS as a global brand with European roots. We believe there is also a significant opportunity to expand our Sierra brand more extensively outside the U.S. market through additional sales and marketing investments.
New Product Development and Innovation. To drive organic growth within our existing businesses, we intend to leverage our strong brand names, customer relationships, proven capacity to develop new innovative products and product extensions in each of our existing product categories, and to expand into new product categories. Our new technologies are generally inspired by our continuing commitment to maximize the enjoyment and efficacy of the products for the outdoor sports for which we design.
Acquisition of Complementary Businesses. We expect to target acquisitions as a viable opportunity to gain access to new product groups, customer channels, and increase penetration of existing markets. We may also pursue acquisitions that diversify the Company within the outdoor and consumer markets. To the extent we pursue future acquisitions, we intend to focus on “super-fan” businesses with leading brands, recurring revenue, sustainable margins and strong cash flow. We anticipate financing future acquisitions prudently through a combination of cash on hand, operating cash flow, bank financings, private placements and new capital markets offerings.
Competitive Strengths
Authentic Portfolio of Iconic Brands. We believe that our brands are iconic among devoted, active-outdoor enthusiasts with a strong reputation for innovation, style, quality, design, safety and durability. Our Black Diamond brand traces its roots to 1957 and has continuously been synonymous with the sports it serves. Our PIEPS brand traces its history to 1967 and has come to represent premium alpine performance in emergency situations. Our Sierra brand was founded in 1947 and we believe represents the most precise and accurate bullets available for the shooting enthusiast. Our SKINourishment brand was founded in 2012, providing fully sustainable, synthetic-free, athlete tested, performance-driven skincare products. Our brands also appeal to everyday customers seeking high-quality products for outdoor or urban and suburban living. Our focus on innovation, safety and style differentiates us from our competitors.
Black Diamond Equipment: Black Diamond Equipment is a global innovator in climbing, trail running, skiing and mountain sports equipment. The brand is synonymous with innovation, performance, safety and durability. Headquartered in Salt Lake City at the base of the Wasatch Mountains, Black Diamond products are created and tested locally on its alpine peaks, slopes, crags and trails. Black Diamond's products are sold in approximately 50 countries around the world.
In 2019, Black Diamond Equipment received over 70 editorial product awards. Black Diamond’s engineering team introduced numerous award-winning products, with the Climb category receiving 10 awards, Mountain category receiving 21 awards, Ski category winning 25 awards, and Apparel category winning 17 awards. Across the Climb category, our airNET harness, designed in collaboration with Adam Ondra, notably earned Gear of the Show from Outside Magazine at Outdoor Retailer Summer Show. Meanwhile, the new Z4 camalot was recognized with Best in Show from Gear Junkie and Gear Institute. Climbing Magazine recognized the C4 camalot and the Ultralight Ice Screw with Editor’s Choice Awards and Adventure Sports Network acknowledged Black Diamond Performance Footwear with Best Climbing Gear of 2019. In the Mountain category, the Distance Carbon Pole won an ISPO award while the Distance pack series won Editor’s Choice from Runner’s World and Trail Sisters as well as a Fitness Award for Best Backpack from Self Magazine. Gear Patrol awarded the lightest in market, Cirrus 9 pack an Editor’s Choice award at Outdoor Retailer Summer Show and Black Diamond headlamps received Editor’s Choice awards from Runner’s World, Popular Mechanics, and The Wirecutter. For Ski, Black Diamond managed to secure Editor’s choice awards for the Helio TM 95, Helio TM Recon 88, Helio TM Recon 105, Razor Carbon Pro Ski Pole, JetForce® Pro, and the Fritschi Tecton 12. In the Apparel category, the Vision Down Parka won recognition for Best New Gear or Editor’s Choice from five different titles and the Rhythm Tee was lauded as “The Only Running Tee I’ll Ever Need.” Our gloves and rainwear also won Editor’s Choice recognition.
4

PIEPS: Headquartered in Lebring, Steiermark, Austria, PIEPS is widely recognized as an innovator and technology leader in alpine sport and safety equipment, focused on beacon technology (having created the modern avalanche transceiver) and avalanche safety equipment. PIEPS offers a focused range of premium avalanche safety products, including transceivers and probes, avalanche airbags, shovels, related equipment, and packs. PIEPS is the official safety partner of the Association of Austrian Mountain and Ski Guides. PIEPS played a key partnership role with Black Diamond Equipment in development of the new JetForce® avalanche airbag and Bluetooth beacon technology platforms.

Sierra: Sierra is an iconic American manufacturer of bullets. Founded in 1947 and based in Sedalia, Missouri, Sierra manufactures a wide range of high-performance bullets and ammunition for both rifles and pistols. Sierra bullets are used for precision target shooting, hunting and military and law enforcement purposes.

SKINourishment: SKINourishment offers organic, 100% food-grade, plant-based skin products that are safe, effective, cruelty-free, non-GMO, vegetarian, and vegan, and some are gluten free. Its synthetic-free skincare products are made with food grade ingredients, are effective for adults, children and animals, and use renewable resources. Its products are sold under four brands—climbOn®, crossFIXE®, POLYN® and POLYN® Baby.
Strong Base of Business. Our outdoor products business benefits from a strong reputation for paradigm-changing, high-quality, innovative products that make us a leader in the outdoor industry with particular strength in product categories such as climbing, trail running, skiing, mountaineering and shooting. Underlying our innovative product lines is a strong stable of intellectual property, with multiple patents and patent applications, as well as valuable brands and trademarks. In addition, our user intimacy, strong retailer partnerships, operations and execution acumen and leadership as a champion in the access, education, and stewardship issues that affect our customers contribute to the robustness of our business.
Product Innovation and Development Capabilities. We have a long history of technical innovation and product development, with over 100 patents and patents pending worldwide. Our employees’ passion and intimacy with our core outdoor activities fosters new and innovative ideas and products, which we believe provides a significant advantage that will drive our Company to new levels. We seek to design products that enhance our customers’ personal performance as they participate in the activities we serve. We integrate quality assurance and quality control teams throughout the entire design process to maintain the quality and integrity that our brands are known for. We believe that our vertically integrated design, development process and enthusiastic employee base provide us with a unique competitive advantage to continue to drive future innovation for our Company and the markets we serve.
Diversified Portfolio by Product, Geography and Channel. Our business is highly diversified across products, geographies, and channels. We operate a multi-brand business with Black Diamond, PIEPS, Sierra, and SKINourishment branded products spanning 30 single product categories addressing four primary categories of climbing, skiing, mountain, and sport. There is no single product category that accounts for more than 15% of annual sales for the year ended December 31, 2019. This provides seasonal diversification with a balance of sales across both the fall/winter and spring/summer sports seasons. Our brands are truly global with approximately 47% of our sales for the year ended December 31, 2019 generated in over 50 countries outside the United States. We believe that our product, geographic, and distribution channel diversity allows us to maximize the reach of our brand portfolio while reducing the risk associated with any single product category or point of distribution.
Experienced and Incentivized Senior Management Team. The members of our Board of Directors and our executive officers, including Mr. Warren Kanders, are substantial stockholders of the Company, and beneficially own approximately 28% of our outstanding common stock as of March 4, 2020, which we believe aligns the interests of our Board of Directors and our executive officers with that of our stockholders.
Growth-oriented Capital Structure. Our capital structure provides us with the capacity to fund future growth and our net operating loss and tax credit carryforwards are expected to offset our net taxable income, which is expected to allow us to retain cash flow for future growth.
5
Operating Segments
We operate our business structure within two segments. These segments are defined based on the internal financial reporting used by management. Certain significant selling and general and administrative expenses are not allocated to the segments. Each segment is described below:
| · | Our Black Diamond segment, which includes Black Diamond Equipment, PIEPS, and SKINourishment, is a global leader in designing, manufacturing, and marketing innovative outdoor engineered equipment and apparel for climbing, mountaineering, trail running, backpacking, skiing, and a wide range of other year-round outdoor recreation activities. Our Black Diamond segment offers a broad range of products including: high-performance, activity-based apparel (such as shells, insulation, midlayers, pants and logowear); rock-climbing footwear and equipment (such as carabiners, protection devices, harnesses, belay devices, helmets, and ice-climbing gear); technical backpacks and high-end day packs; trekking poles; headlamps and lanterns; gloves and mittens; and skincare and other sport-enhancing products. We also offer advanced skis, ski poles, ski skins, and snow safety products, including avalanche airbag systems, avalanche transceivers, shovels, and probes. |
| · | Our Sierra segment, which includes Sierra, is an iconic American manufacturer of a wide range of high-performance bullets and ammunition for both rifles and pistols. These bullets are used for precision target shooting, hunting and military and law enforcement purposes. |
See Note 15 to our consolidated and combined financial statements for financial information regarding our segments.
Products
Our products span 30 single product categories and include a wide variety of technical outdoor equipment and lifestyle products for a wide range of outdoor enthusiasts, including climbers, mountaineers, trail runners, skiers, backpackers and campers, competitive shooters, hunters and other outdoor-inspired consumers. We design many of our products for extreme applications, such as high-altitude mountaineering, ice and rock climbing, as well as backcountry skiing and alpine touring. We also manufacturer high-quality bullets and ammunition with the tightest tolerances in the industry that enhance the performance of competitive shooters and hunters. We are also seeking to develop skincare products, such as lotions, lip balm, and sunscreen, as well as sport-enhancing supplements, nutrition, and other products using natural, organic or alternative ingredients. Generally, we divide our product offerings into the following four primary categories:
| · | Climb: Our climb line consists of apparel, footwear, and equipment such as belay/rappel devices, bouldering products, carabiners, climbing packs, crampons, harnesses, ice axes, protection devices, a bouldering line of technical apparel, and various other climbing accessories and skincare products. Our climb line represented approximately 31% of our sales during the year ended December 31, 2019. |
| · | Mountain: Our mountain line consists of apparel, gloves, packs, headlamps, lights, tents, trekking poles, and various other hiking and mountaineering accessories. Our mountain line represented approximately 34% of our sales during the year ended December 31, 2019. |
| · | Ski: Our ski line consists of technical apparel, avalanche airbags, packs, bindings, poles, skis, snow gloves, avalanche safety devices, and other skiing accessories. Our ski line represented approximately 22% of our sales during the year ended December 31, 2019. |
| · | Sport: Our sport line consists of premium quality high-precision bullets and ammunition used in competitive shooting, hunting and other applications and environments. Our sport line represented approximately 13% of our sales during the year ended December 31, 2019. |
6
Product Design and Development
We conduct our product research, evaluation, and design activities at our locations in Salt Lake City, Utah, Sedalia, Missouri, Lebring, Austria, and Wimberly, Texas.
We typically bring new products from concept to market in approximately 18 to 36 months depending upon the technology integration and complexity of the product. We work simultaneously on product lines for the four subsequent selling seasons.
We expense research and development costs as incurred in selling, general, and administrative expenses. As of December 31, 2019, we had 82 employees dedicated to research and development.
Customers
We market and distribute our products in over 50 countries, primarily through independent specialty stores and specialty chains, premium sporting goods and outdoor recreation stores, distributors and OEMs in the United States, Canada, Europe, Middle East, Asia, Australia, New Zealand, Africa, and South America. Outside of North America and Europe, we sell our products through independent global distributors into specialty retail stores. We also sell our products directly to customers through our various websites.
Our end users include a broad range of consumers, including mountain, rock, ice, and gym climbers, winter-outdoor enthusiasts, trail runners, backpackers, competitive shooters, hunters, and outdoor-inspired consumers. Such consumers demand high-quality, reliable, and high-precision products to enhance their performance and, in some cases, safety in a multitude of outdoor activities. We expect to leverage our user intimacy, engineering prowess, and design ability to expand into related technical product categories that target the same demographic group and distribution channels.
During 2019, REI accounted for approximately 14% of our sales. The loss of this customer could have a material adverse effect on us.
Sales and Marketing
Our sales force is generally deployed by geographic region: Canada, Europe, Asia Pacific, Latin America, and the United States. Our focus is on providing our products to a broad spectrum of outdoor enthusiasts. Within each of our brands, we strive to create a unique look for our products and to communicate those differences to the consumer. In addition, we are continuously exploring uses for brand and market research. We also regularly utilize various promotions and public relations campaigns.
We have consistently established relationships with professional athletes and influencers to help evaluate, promote and establish product performance and authenticity with customers. Such brand endorsers are one of many elements in our array of marketing materials, including instore displays, catalogs, workbooks, social media, and digital campaigns via our websites.
7
Manufacturing, Sourcing, Quality Assurance and Distribution
Manufacturing
Our objective is to deliver on-time the highest quality of products in the safest and most cost-efficient manner. Our culture of continuous improvement and implementation of industry best practices, allows us to continue to increase productivity, reduce costs, and bring new innovative products to the market.
The Black Diamond Equipment and PIEPS manufacturing and distribution operations are ISO 9001–2015 certified and are audited annually by an independent certifying agency to ensure Black Diamond Equipment’s and PIEPS’ quality management systems meet the requirements of ISO 9001–2015, and to ensure that Black Diamond Equipment’s and PIEPS’ certified products meet all necessary performance certification requirements. Sierra employs a best-in-class proprietary manufacturing process with respect to each one of its products. This process is performed in-house and includes control of bullet jacket wall concentricity utilizing strict quality control standards overseen by experienced employees, yielding what we believe to be the tightest tolerances in the industry.
We manufactured approximately 20% to 25% of our products, including nearly all climbing hard goods and bullets, in our facilities in the United States. The remaining approximately 75% to 80% of our products are also manufactured to our specifications in third-party, independently-owned facilities. We keep employees and agents on-site or via regular visits at these third-party, independently-owned facilities to ensure that our products are manufactured to meet our specifications. While we do not maintain a long-term manufacturing contract with those facilities, we believe that our long-term relationships with them will help to ensure that a sufficient supply of goods built to our specification are available in a timely manner and on satisfactory economic terms in the future.
Sourcing
We source raw materials and components from a variety of suppliers. Our primary raw materials include copper, lead, aluminum, steel, nylon, corrugated cardboard for packaging, metal, plastic and electrical components, and various textiles, foams, and fabrics. The raw materials and components used to manufacture our products are generally available from numerous suppliers in quantities sufficient to meet normal requirements.
We source packaging materials both domestically as well as from sources in Asia and Europe. We believe that all of our purchased products and materials could be readily obtained from alternative sources at comparable costs.
Quality Assurance
Quality assurance at the Company has two primary functions:
| · | The first is to ensure that the products that we design and develop are manufactured to meet or exceed the Company’s own standards and international regulatory standards. This involves creating inspection documentation, reviewing manufacturing processes with our various vendor-partners, and inspecting finished product to assure it meets the rigorous standards required by our customers. These activities take place globally, wherever our products are manufactured. |
| · | The second function is to provide real and meaningful input to the new product development process. Quality assurance professionals interact closely with the design and engineering teams and bring knowledge and expertise to the design process, ensuring that the products we bring to market truly meet the criteria established when a new product is envisioned. |
The engineering prowess of the quality assurance group is a core competency that the Company seeks to leverage across all product lines and brands.
Global Distribution
Our distribution model allows us to ship a broad cross-section of our product line in smaller quantities to our own global distribution centers and to those of our Independent Global Distributors (IGD) more frequently and at lower transportation and logistics costs.
Competition
Because of the diversity of our product offerings, we compete by niche with a variety of companies. Our products must stand up to the high standards set by the end users in each category where quality, durability and performance are paramount. We believe our products compete favorably on the basis of product innovation, product performance, marketing support, and price.
The popularity of various outdoor activities and changing design trends affect the desirability of our products. Therefore, we seek to anticipate and respond to trends and shifts in consumer preferences by adjusting the mix of available product offerings by developing new products with innovative performance features and designs, and by marketing our products in a persuasive and memorable fashion to drive consumer awareness and demand. Failure to anticipate or respond to consumer needs and preferences in a timely and adequate manner could have a material adverse effect on our sales and profitability.
8
We compete with niche, privately-owned companies as well as a number of brands owned by large, multinational companies, such as those set forth below.
| · | Climb: Our climbing products and accessories, such as apparel, footwear, protection, carabiners, helmets, and harnesses, compete with products from companies such as La Sportiva, Prana, Patagonia, Petzl, CAMP, EDELRID, and Mammut. |
| · | Mountain: Our mountaineering products and accessories, such as backpacks, trekking poles, headlamps, and tents, compete with products from companies such as Petzl, Deuter, Leki, Komperdell, Marmot, Mountain Hardwear, Hestra, Osprey, Salomon, and The North Face. |
| · | Ski: Our skiing products and accessories, such as technical apparel, skis, poles, avalanche airbags and transceivers, compete with products from competitors such as Arc’Teryx, Backcountry Access, Dynafit (Salewa), Atomic, Mammut, Marker, Ortovox, Salomon, Scarpa, Scott, and Volkl. |
| · | Sport: We sell both bullets and ammunition to both retailers and distributors for sale to consumers but also supply bullets to OEMs who also sometimes manufacture bullets as well. Such companies include Vista, Nammo, Hornady, Fiocchi, Olin, and Remington. |
In addition, in certain categories we compete with certain of our large wholesale customers who focus on the outdoor market, such as REI, Mountain Equipment Co-op and Decathlon, which manufacture, market and distribute their own climbing, mountaineering, and skiing products under their own private labels.
Intellectual Property
We believe our registered and pending word and icon trademarks worldwide, including the Black Diamond and Diamond “C” logos, Black Diamond®, ATC ®, Camalot®, AvaLung ®, FlickLock®, Ascension™, Time is Life®, Hexentric®, Stopper®, Dawn Patrol®, Bibler®, “Use.Design.Build.Engineer.Repeat”™, Sierra®, Sierra® MatchKing®, Sierra® GameKing®, Sierra® BlitzKing® and PIEPS®, create international brand recognition for our products.
Solely for convenience, our trademarks and tradenames referred to in this report may appear without the ® and ™ symbols, but those references are not intended to indicate, in any way, that we will not assert, to the fullest extent under applicable law, our rights, or the right of the applicable licensor to these trademarks and tradenames.
We believe our brands have an established reputation for innovation, style, quality, design, safety, and durability, and accordingly, we actively monitor and police our brands against infringement to ensure their viability and enforceability.
In addition to trademarks, we hold over 100 patents and patents pending worldwide for a wide variety of technologies across our product lines.
Our success with our proprietary products is generally derived from our “first mover” advantage in the market as well as our commitment to protecting our current and future proprietary technologies and products, which acts as a deterrent to infringement of our intellectual property rights. While we believe our patent and trademark protection policies are robust and effective, if we fail to adequately protect our intellectual property rights, competitors may manufacture and market products similar to ours. Our principal intellectual property rights include our patents and trademarks but also include products containing proprietary trade secrets and manufacturing know-how.
We cannot be sure that we will receive patents for any of our patent applications or that any existing or future patents that we receive or license will provide competitive advantages for our products. While we actively monitor our competitors to ensure that we do not compromise the intellectual property of others, we cannot be sure that competitors will not challenge, invalidate or void the application of any existing or future patents that we receive or license. In addition, patent rights may not prevent our competitors from developing, using or selling products that are in similar product niches as ours.
Seasonality
The Company’s products are outdoor activity-based, which results in seasonal variations in sales and profitability. On a calendar year basis, we generally experience our greatest sales in the first and second quarters for certain of our products including rock climbing gear, footwear, and harnesses, and in the third and fourth quarters for our ski, glove, ice climbing and snow safety products. Sales of these products may be negatively affected by unfavorable weather conditions and other market trends. During 2019, the fall/winter season represents approximately 53% of our sales while spring/summer represents approximately 47% of our sales. Sales of other products such as headlamps, lanterns, trekking poles, packs and bullets are generally balanced throughout the year.
9
Working capital requirements vary throughout the year. Working capital generally increases to support peak shipping periods and then generally decreases during the second quarter of the year as accounts receivable are collected.
Environmental Matters
Our operations are subject to federal, state, and local environmental, health and safety laws and regulations, including those that impose workplace standards and regulate the discharge of pollutants into the environment and establish standards for the handling, generation, emission, release, discharge, treatment, storage, and disposal of materials and substances including solid and hazardous wastes. We believe that we are in material compliance with such laws and regulations. Further, the cost of maintaining compliance has not, and we believe in the future, will not have a material adverse effect on our business, consolidated results of operations, and consolidated financial condition. Due to the nature of our operations and the frequently changing nature of environmental compliance standards and technology, we cannot predict with any certainty that future material capital or operating expenditures will not be required in order to comply with applicable environmental laws and regulations.
Employees
As of December 31, 2019, we had over 500 employees worldwide. We have not experienced any work stoppages or employee-related slowdowns and believe that our relationship with employees is satisfactory.
Executive Officers of the Registrant
The executive officers of our Company as of December 31, 2019 are as follows:
Warren B. Kanders, 62, our Executive Chairman, has served as one of our directors since June 2002 and as Executive Chairman of our Board of Directors since December 2002. Since 1990, Mr. Kanders has served as the President of Kanders & Company, Inc., a private investment firm principally owned and controlled by Mr. Kanders, which makes investments in and provides consulting services to public and private entities. From January 1996 until its sale to BAE Systems plc on July 31, 2007, Mr. Kanders served as the Chairman of the Board of Directors, and from April 2003 as the Chief Executive Officer, of Armor Holdings, Inc., formerly a New York Stock Exchange-listed company and a manufacturer and supplier of military vehicles, armored vehicles, and safety and survivability products and systems to the aerospace and defense, public safety, homeland security, and commercial markets. Mr. Kanders received an A.B. degree in Economics from Brown University.
John C. Walbrecht, 52, has served as the President of the Company since October 2017, and President of BDEL since October 2016. Before joining the Company, Mr. Walbrecht served as the President of Mountain Hardwear from March 2016 to October 2016. Prior to Mountain Hardwear, Mr. Walbrecht served as the President and Chief Executive Officer of Fenix Outdoors NA from January 2012 until March 2016. Mr. Walbrecht has also served in various senior roles with Brandbase, Spyder, Dr. Martens/Airwair, and Timberland. Mr. Walbrecht holds a Master of Business Administration and a Bachelor of Science in Economics from Brigham Young University, a Bachelor of Arts in Marketing from the University of Maryland and understudies in International Trade and Finance at Cambridge University - Trinity College.
Aaron J. Kuehne, 41, has served as our Chief Financial Officer, Secretary and Treasurer, since 2013 and as our Chief Administrative Officer since May 2016. Mr. Kuehne previously served as the Company’s interim Chief Financial Officer, in addition to serving as its Vice President of Finance, principal financial officer and principal accounting officer. Before joining the Company in September 2010, Mr. Kuehne served as the Corporate Controller of Certiport from August 2009 to September 2010. From July 2004 to August 2009, Mr. Kuehne served in various capacities with KPMG LLP, most recently as Audit Manager. Mr. Kuehne received an M.B.A. degree from the University of Utah – David Eccles School of Business in 2004 and graduated with a Bachelor of Arts degree in Accounting from University of Utah – David Eccles School of Business in 2002.
Available Information
Our Internet address is www.claruscorp.com. We make available free of charge on or through our website our annual reports on Form 10-K, quarterly reports on Form 10-Q, current reports on Form 8-K, and amendments to those reports, and the proxy statement for our annual meeting of stockholders as soon as reasonably practicable after we electronically file such material with, or furnish it to, the Securities and Exchange Commission. Forms 3, 4 and 5 filed with respect to our equity securities under Section 16(a) of the Securities Exchange Act of 1934, as amended, are also available on our website. All of the foregoing materials are located at the ‘‘SEC Filings’’ tab under the section titled “Investor Relations.” The information found on our website shall not be deemed incorporated by reference by any general statement incorporating by reference this report into any filing under the Securities Act of 1933, as amended, or under the Securities Exchange Act of 1934, as amended, and shall not otherwise be deemed filed under such Acts.
The Securities and Exchange Commission also maintains a website that contains reports, proxy and information statements, and other information regarding issuers that file electronically with the Securities and Exchange Commission at www.sec.gov. In addition, you may request a copy of any such materials, without charge, by submitting a written request to: Clarus Corporation, c/o the Secretary, 2084 East 3900 South, Salt Lake City, UT 84124. The contents of the websites identified above are not incorporated into this Annual Report on Form 10-K.
10
In addition to other information contained in this Annual Report on Form 10-K, the following risk factors should be carefully considered in evaluating our business, because such factors may have a significant impact on our business, operating results, liquidity and financial condition. As a result of the risk factors set forth below, actual results could differ materially from those mentioned in any forward-looking statements. Additional risks and uncertainties not presently known to us, or that we currently consider to be immaterial, may also impact our business, operating results, liquidity and financial condition. If any of the following risks occur, our business, operating results, liquidity and financial condition, and the price of our common stock, could be materially adversely affected.
Risks Related to Our Industry
Many of the products we sell are used for inherently risky outdoor pursuits and could give rise to product liability or product warranty claims and other loss contingencies, which could affect our earnings and financial condition.
Many of our products are used in applications and situations that involve high levels of risk of personal injury and death. As a result, we maintain a staff who focus on the appropriate disclaimers and markings and testing and seek to assure the quality and safety of our products. We stay current with the law to seek to provide thorough and protective disclaimers and instructions on all of our products and packaging. Furthermore, our technical climbing and avalanche safety equipment and our related operations meet and are certified to International Personal Protective Equipment (PP) standards set by the EEC or ISO 9001 quality system standards. Failure to use our products for their intended purposes, failure to use or care for them properly, or their malfunction, or, in some limited circumstances, even correct use of our products, could result in serious bodily injury or death.
We remain exposed to product liability claims by the nature of the products we produce. Exposure occurs if one of our products is alleged to have resulted in property damage, bodily injury or other adverse effects. Any such product liability claims may include allegations of defects in manufacturing, defects in design, a failure to warn of dangers inherent in the product or activities associated with the product, negligence, strict liability, and a breach of warranties. Although we maintain product liability insurance in amounts that we believe are reasonable, there can be no assurance that we will be able to maintain such insurance on acceptable terms, if at all, in the future or that product liability claims will not exceed the amount of insurance coverage. Additionally, we do not maintain product recall insurance. As a result, product recalls or product liability claims could have a material adverse effect on our business, results of operations and financial condition.
As a manufacturer and distributor of consumer products, we are subject to the Consumer Products Safety Act, which empowers the Consumer Products Safety Commission to exclude from the market products that are found to be unsafe or hazardous. Under certain circumstances, the Consumer Products Safety Commission could require us to repurchase or recall one or more of our products. Additionally, laws regulating certain consumer products exist in some cities and states, as well as in other countries in which we sell our products, and more restrictive laws and regulations may be adopted in the future. Any repurchase or recall of our products could be costly to us and could damage our reputation. If we were required to remove, or we voluntarily removed, our products from the market, our reputation could be tarnished and we might have large quantities of finished products that we could not sell.
We spend substantial resources ensuring compliance with governmental and other applicable standards. However, compliance with these standards does not necessarily prevent individual or class action lawsuits, which can entail significant cost and risk. We do not maintain insurance against many types of claims involving alleged defects in our products that do not involve personal injury or property damage. As a result, these types of claims could have a material adverse effect on our business, results of operations, and financial condition.
Our product liability insurance program is an occurrence-based program based on our current and historical claims experience and the availability and cost of insurance. We carry both general and umbrella liability policies that insure us for product liability claims. The policy has a small retention, which enables us to manage and control our product liability claims. Historically, product liability awards have not exceeded our individual per occurrence self-insured retention. We cannot assure you, however, that our future product liability experience will be consistent with our past experience.
A substantial portion of our sales and gross profit is derived from a small number of large customers, none of whom are contractually obligated to continue buying our products. The loss of any of these customers could substantially reduce our profits.
A customer accounts for a significant portion of revenues. In the year ended December 31, 2019, REI accounted for approximately 14% of sales. Sales are generally on a purchase order basis, and we do not have long-term agreements with any of our customers. A decision by any of our major customers to decrease significantly the number of products purchased from us could substantially reduce sales and have a material adverse effect on our business, financial condition and results of operations. Moreover, in recent years, the retail industry has experienced consolidation and other ownership changes. In the future, retailers may further consolidate, undergo restructurings or reorganizations, realign their affiliations or reposition their stores’ target market. These developments could result in a reduction in the number of stores that carry our products, increased ownership concentration within the retail industry, increased credit exposure, and increased retailer leverage over their suppliers. These changes could impact our opportunities in the market and increase our reliance on a smaller number of large customers.
11
We are subject to risks related to our dependence on the strength of retail economies in various parts of the world and our performance may be affected by general economic conditions.
Our business depends on the strength of the retail economies in various parts of the world, primarily in North America, Europe and to a lesser extent, Asia, Central and South America. These retail economies are affected primarily by factors such as consumer demand and the condition of the retail industry, which, in turn, are affected by general economic conditions and specific events such as natural disasters, terrorist attacks, and political unrest. The impact of these external factors is difficult to predict, and one or more of the factors could adversely impact our business, results of operations, and financial condition.
Purchases of many consumer products are discretionary and tend to be highly correlated with the cycles of the levels of disposable income of consumers. As a result, any substantial deterioration in general economic conditions could adversely affect consumer discretionary spending patterns, our sales, and our results of operations. In particular, decreased consumer confidence or a reduction in discretionary income as a result of unfavorable macroeconomic conditions may negatively affect our business. If the macroeconomic environment worsens, consumers may reduce or delay their purchases of our products. Any such reduction in purchases could have a material adverse effect on our business, financial condition, and results of operations.
Changes in the retail industry and markets for consumer products affecting our customers or retailing practices could negatively impact existing customer relationships and our results of operations.
We sell our products to retailers, including sporting goods and specialty retailers, as well as direct to consumers. A significant deterioration in the financial condition of our major customers could have a material adverse effect on our sales and profitability. We regularly monitor and evaluate the credit status of our customers and attempt to adjust sales terms as appropriate. Despite these efforts, a bankruptcy filing by a key customer could have a material adverse effect on our business, results of operations, and financial condition.
In addition, as a result of the desire of retailers to more closely manage inventory levels, there is a growing trend among retailers to make purchases on a “just-in-time” basis. This requires us to shorten our lead time for production in certain cases and more closely anticipate demand, which could in the future require us to carry additional inventories.
We may be negatively affected by changes in the policies of our retailer customers, such as inventory destocking, limitations on access to and time on shelf space, use of private label brands, price demands, payment terms, and other conditions, which could negatively impact our results of operations.
There is a growing trend among retailers in the U.S. and in foreign markets to undergo changes that could decrease the number of stores that carry our products or increase the concentration of ownership within the retail industry, including:
| · | consolidating their operations; |
| · | undergoing restructurings or store closings; |
| · | undergoing reorganizations; or |
| · | realigning their affiliations. |
These consolidations could result in a shift of bargaining power to the retail industry and in fewer outlets for our products. Further consolidations could result in price and other competition that could reduce our margins and our net sales.
Seasonality and weather conditions may cause our operating results to vary from quarter to quarter.
Sales of certain of our products are seasonal. Sales of our outdoor recreation products such as carabineers, harnesses, and related climbing equipment products increase during warm weather months and decrease during winter, while sales of our apparel line and winter sports equipment such as our skis and related ski equipment increase during the cold weather months and decrease during summer. Weather conditions may also negatively impact sales. For instance, milder temperatures could prevent the formation of ice, which may negatively affect demand for our ice climbing products, and mild winter weather with less snowfall may negatively impact sales of our winter sports products. These factors could have a material adverse effect on our business, results of operations, and financial condition.
12
Global climate change trends could affect our suppliers and customers and result in increased regulation.
The effects of climate change, such as intensified rainfalls and flooding, prolonged droughts, wildfires, rising sea levels and increasing heat and humidity, can have an adverse effect not only to our operations, but also that of our suppliers and customers, and can lead to increased regulations and changes in consumer preferences, which could adversely affect our business, results of operations and financial condition.
Our results of operations could be materially harmed if we are unable to accurately forecast demand for our products.
We often schedule internal production and place orders for products with independent manufacturers before our customers’ orders are firm. Therefore, if we fail to accurately forecast customer demand, we may experience excess inventory levels or a shortage of product to deliver to our customers. Factors that could affect our ability to accurately forecast demand for our products include:
| · | an increase or decrease in consumer demand for our products or for products of our competitors; |
| · | our failure to accurately forecast customer acceptance of new products; |
| · | new product introductions by competitors; |
| · | unanticipated changes in general market conditions or other factors, which may result in cancellations of orders or a reduction or increase in the rate of reorders placed by retailers; |
| · | weak economic conditions or consumer confidence, which could reduce demand for discretionary items such as our products; |
| · | disease epidemics and health-related concerns, which could adversely affect consumer spending; and |
| · | terrorism or acts of war, or the threat of terrorism or acts of war, which could adversely affect consumer confidence and spending or interrupt production and distribution of product and raw materials. |
Inventory levels in excess of customer demand may result in inventory write-downs and the sale of excess inventory at discounted prices, which could have an adverse effect on our business, results of operations, and financial condition. On the other hand, if we underestimate demand for our products, our manufacturing facilities or third-party manufacturers may not be able to produce products to meet customer requirements, and this could result in delays in the shipment of products and lost revenues, as well as damage to our reputation and customer relationships. There can be no assurance that we will be able to successfully manage inventory levels to exactly meet future order and reorder requirements.
Competition in our industries may hinder our ability to execute our business strategy, achieve profitability, or maintain relationships with existing customers.
We operate in a highly competitive industry. In this industry, we compete against numerous other domestic and foreign companies. Competition in the markets in which we operate is based primarily on product quality, product innovation, price, and customer service and support, although the degree and nature of such competition vary by location and product line. Some of our competitors are more established in their industries and have substantially greater revenue or resources than we do. Our competitors may take actions to match new product introductions and other initiatives. Since many of our competitors also source their products from third parties, our ability to obtain a cost advantage through sourcing is reduced. Certain of our competitors may be willing to reduce prices and accept lower profit margins to compete with us. Further, retailers often demand that suppliers reduce their prices on existing products. Competition could cause price reductions, reduced profits or losses or loss of market share, any of which could have a material adverse effect on our business, results of operations, and financial condition.
To compete effectively in the future in the consumer products industry, among other things, we must:
| · | maintain strict quality standards; |
| · | develop new and innovative products that appeal to consumers; |
| · | deliver products on a reliable basis at competitive prices; |
| · | anticipate and respond to changing consumer trends in a timely manner; |
| · | maintain favorable brand recognition; and |
| · | provide effective marketing support. |
Our inability to do any of these things could have a material adverse effect on our business, results of operations and financial condition.
13
If we fail to expand existing or develop new customer relationships, our ability to grow our business will be impaired.
Our growth depends to a significant degree upon our ability to expand existing relationships with current customers or develop new customer relationships. We cannot guarantee that new customers will be found, that any such new relationships will be successful when we do get them, or that business with current customers will increase. Failure to develop and expand such relationships could have a material adverse effect on our business, results of operations, and financial condition.
If we fail to adequately protect our intellectual property rights, competitors may manufacture and market products similar to ours, which could adversely affect our market share and results of operations.
Our success with our proprietary products depends, in part, on our ability to protect our current and future technologies and products and to defend our intellectual property rights. If we fail to adequately protect our intellectual property rights, competitors may manufacture and market products similar to ours. Our principal intellectual property rights include our trademarks, patents, and trade secrets.
We hold numerous patents for the invention of new or improved technologies, which are known as utility patents, and pending patent applications covering a wide variety of products. We cannot be sure that we will receive patents for any of our patent applications or that any existing or future patents that we receive or license will provide competitive advantages for our products. We also cannot be sure that competitors will not challenge, invalidate or avoid the application of any existing or future patents that we receive or license. In addition, patent rights may not prevent our competitors from developing, using or selling products that are similar or functionally equivalent to our products.
Third parties may have patents, or may be awarded new patents, that may materially adversely affect our ability to market, distribute and sell our products. Accordingly, our products, including, but not limited to, our technical climbing and backpack products, may become subject to patent infringement claims or litigation, any adverse determination of which could have a material adverse effect on our business, results of operations, and financial condition.
Changes in foreign, cultural, political, and financial market conditions could impair our international operations and financial performance.
Some of our operations are conducted or products are sold in countries where economic growth has slowed, such as Japan, or where economies have suffered economic, social and/or political instability or hyperinflation, including, for example, the uncertainty related to the United Kingdom’s withdrawal from the European Union (commonly known as “Brexit”), which may have an impact on our business, particularly in the United Kingdom and in Europe. Furthermore, events such as Brexit and political uncertainty around the effects of current or future ‘trade wars’ may create global economic uncertainty, which may cause consumers to reduce their spending.
Additionally, some of our operations are conducted or products are sold in countries where the ability to repatriate funds has been delayed or impaired in recent years. Current government economic and fiscal policies, including stimulus measures and currency exchange rates and controls in these economies may not be sustainable and, as a result, our sales or profits related to those countries may decline.
The economies of other foreign countries important to our operations, including other countries in Asia and Europe, could also suffer slower economic growth or economic, social and/or political instability or hyperinflation in the future. International operations, including manufacturing and sourcing operations (and the international operations of our customers), are subject to inherent risks which could adversely affect us, including, among other things:
| · | protectionist policies restricting or impairing the manufacturing, sales or import and export of our products; |
| · | new restrictions on access to markets; |
| · | lack of developed infrastructure; |
| · | inflation or recession; |
| · | devaluations or fluctuations in the value of currencies; |
| · | changes in and the burdens and costs of compliance with a variety of foreign laws and regulations, including tax laws, accounting standards, environmental laws and occupational health and safety laws; |
| · | social, political or economic instability; |
| · | acts of war and terrorism; |
| · | natural disasters or other crises; |
| · | reduced protection of intellectual property rights in some countries; |
| · | increases in duties and taxation; and |
| · | restrictions on transfer of funds and/or exchange of currencies; expropriation of assets; and other adverse changes in policies, including monetary, tax and/or lending policies, relating to foreign investment or foreign trade by our host countries. |
14
Should any of these risks occur, our ability to sell or export our products or repatriate profits could be impaired and we could experience a loss of sales and profitability from our international operations, which could have a material adverse impact on our business.
If we cannot continue to develop new products in a timely manner, and at favorable margins, we may not be able to compete effectively.
We believe that our future success will depend, in part, upon our ability to continue to introduce innovative design extensions for our existing products and to develop, manufacture, and market new products. We cannot assure you that we will be successful in the introduction, manufacturing, and marketing of any new products or product innovations, or develop and introduce, in a timely manner, innovations to our existing products that satisfy customer needs or achieve market acceptance. Our failure to develop new products and introduce them successfully and in a timely manner, and at favorable margins, would harm our ability to successfully grow our business and could have a material adverse effect on our business, results of operations, and financial condition.
Our operating results can be adversely affected by changes in the cost or availability of raw materials.
Pricing and availability of raw materials for use in our businesses can be volatile due to numerous factors beyond our control, including general, domestic, and international economic conditions, labor costs, production levels, competition, consumer demand, import duties, and tariffs and currency exchange rates. This volatility can significantly affect the availability and cost of raw materials for us, and may therefore have a material adverse effect on our business, results of operations, and financial condition.
During periods of rising prices of raw materials, there can be no assurance that we will be able to pass any portion of such increases on to customers. Conversely, when raw material prices decline, customer demands for lower prices could result in lower sale prices and, to the extent we have existing inventory, lower margins. We currently do not hedge against our exposure to changing raw material prices. As a result, fluctuations in raw material prices could have a material adverse effect on our business, results of operations, and financial condition.
Supply shortages or changes in availability for any particular type of raw material can delay production or cause increases in the cost of manufacturing our products. We may be negatively affected by changes in availability and pricing of raw materials, which could negatively impact our results of operations.
Our operations in international markets, and earnings in those markets, may be affected by legal, regulatory, political, and economic risks.
Our ability to maintain the current level of operations in our existing international markets and to capitalize on growth in existing and new international markets is subject to risks associated with international operations. These include the burdens of complying with a variety of foreign laws and regulations, unexpected changes in regulatory requirements, new tariffs or other barriers to some international markets. For example, any future withdrawal or renegotiation of trade agreements, and the prosecution of trade disputes or the imposition of tariffs, duties, taxes and other charges on imports or exports between the United States and countries like China may adversely affect our ability to operate our business and execute our growth strategy. In addition, it may be more difficult for us to enforce agreements, collect receivables, receive dividends and repatriate earnings through foreign legal systems.
We cannot predict whether quotas, duties, taxes, exchange controls or other restrictions will be imposed by the United States, China, or other countries upon the import or export of our products and the commodities and components used to manufacture our products, or what effect any of these actions would have on our business, financial condition or results of operations. We cannot predict whether there might be changes in our ability to repatriate earnings or capital from international jurisdictions. Changes in regulatory and geopolitical policies and other factors may adversely affect our business or may require us to modify our current business practices.
Approximately 47% of our sales for the year ended December 31, 2019 were earned in international markets. We are exposed to risks of changes in U.S. policy for companies having business operations outside the United States, which could have a material adverse effect on our business, results of operations, and financial condition.
We use foreign suppliers and manufacturing facilities for a significant portion of our raw materials and finished products, and disruptions to international trade, such as disease epidemics or potential ‘trade wars,’ pose a risk to our business operations.
A majority of our products sold were produced by and purchased from independent manufacturers primarily located in Asia and Eastern Europe, with substantially all of the remainder produced by our manufacturing facility located in Utah. Although no single supplier and no one country controls a majority of our production needs, any of the following could materially and adversely affect our ability to produce or deliver our products and, as a result, have a material adverse effect on our business, financial condition, and results of operations:
15
| · | political or labor instability in countries where our facilities, contractors, and suppliers are located; |
| · | political or military conflict, which could cause a delay in the transportation of raw materials and products to us and an increase in transportation costs; |
| · | heightened terrorism security concerns, which could subject imported or exported goods to additional, more frequent or more lengthy inspections, leading to delays in deliveries or impoundment of goods for extended periods or could result in decreased scrutiny by customs officials for counterfeit goods, leading to lost sales, increased costs for our anti-counterfeiting measures and damage to the reputation of our brands; |
| · | disease epidemics and health-related concerns, such as the coronavirus, H1N1 virus, bird flu, SARS, mad cow, and hoof-and-mouth disease outbreaks in recent years, which could result in closed factories, reduced workforces, scarcity of raw materials, and scrutiny or embargo of our goods produced in infected areas; |
| · | imposition of regulations and quotas relating to imports and our ability to adjust timely to changes in trade regulations, which, among other things, could limit our ability to produce products in cost-effective countries that have the labor and expertise needed; |
| · | imposition of tariffs, duties, taxes and other charges on imports and/or exports; and |
| · | imposition or the repeal of laws that affect intellectual property rights. |
For instance, in December of 2019, a strain of novel coronavirus causing respiratory illness emerged in the city of Wuhan in the Hubei province of China. While the Chinese and other international governments have taken certain emergency measures to combat the spread of the coronavirus, including implementing quarantines in Wuhan and the surrounding areas and implementing significant restrictions on travel, the coronavirus has nonetheless spread both within China and internationally. Certain of our materials and products are sourced from, or warehoused and shipped through, suppliers and manufacturers located in China or other areas that may be impacted by the coronavirus. While the full impact of this outbreak is unknown at this time, we are closely monitoring the developments in China and internationally and continually assessing the potential impact on our business. Any prolonged disruption to our suppliers and manufacturers could have a material adverse effect on our business, financial condition and results of operations.
In addition, the recent imposition of tariffs by the United States on certain imported products, and the retaliatory imposition by certain other countries of tariffs on certain U.S. products imported into such countries, could result in the escalation of tariffs or other restrictions on trade between such countries. Any ‘trade war’ that arises, including one arising from the events discussed above, could have a material adverse effect on our business, financial condition and results of operations.
Our business is subject to foreign, national, state, and local laws and regulations for environmental, employment, safety, and other matters. The costs of compliance with, or the violation of, such laws and regulations by us or by independent suppliers who manufacture products for us could have an adverse effect on our business, results of operations and financial condition.
Numerous governmental agencies in the United States and in other countries in which we have operations, enforce comprehensive national, state, and local laws and regulations on a wide range of environmental, employment, health, safety, and other matters. We could be adversely affected by costs of compliance or violations of those laws and regulations. In addition, the costs of products purchased by us from independent contractors could increase due to the costs of compliance by those contractors. Further, violations of such laws and regulations could affect the availability of inventory, thereby affecting our net sales.
Changes in governmental regulation, legislation or public opinion regarding the manufacture and sale of bullets, or the possession and use of firearms and ammunition, could adversely affect our Sierra segment and overall financial results.
The manufacture and sale of bullets by our Sierra segment, and the possession and use of firearms and ammunition by our customers, is subject to significant governmental regulation. We hold all licenses necessary for the legal manufacture and sale of our bullets. However, federal, state or local legislatures may enact further legislation regarding the manufacture and sale of bullets, and the possession and use of firearms and ammunition by our customers, such as point-of-sale background checks, age and other restrictions on ammunition purchases or further licensing of ammunition dealers. Such legislation, if enacted, could materially and adversely affect the sale of bullets that we manufacture.
The manufacture and sale of bullets, and the possession and use of firearms and ammunition, is also the subject of significant public interest and debate. If public opinion should worsen, it may lead to boycotts of certain of our products and decreased demand for the bullets and other products we manufacture by consumers and the other constituencies with which we deal, including suppliers, distributors and retailers, all of which could be a catalyst for potentially adverse reactions from our shareholders.
16
We cannot assure you that governmental regulation, legislation or public opinion regarding the manufacture and sale of bullets, or the possession and use of firearms and ammunition, will not become more restrictive or worsen in the future. We also cannot assure you that any such negative public opinion relating to our Sierra segment would not affect our Black Diamond segment, nor can we assure you that any such changes in governmental regulation, legislation or public opinion will not have a material adverse effect on our business, results of operations or financial condition.
Our SKINourishment business is subject to substantial government regulation relating to personal care products that could have a material adverse effect on our business.
Government regulation in the United States and other countries is a significant factor affecting the research, development, formulation, manufacture and marketing of our SKINourishment skincare products. In the United States, the Food and Drug Administration’s (the “FDA”) has broad authority to regulate the design, manufacture, formulation, marketing and sale of our SKINourishment skincare products. FDA’s regulation of personal care products includes ingredient, quality, and labeling requirements. Also in the United States, the Federal Trade Commission (the “FTC”) has broad authority over all product advertising to ensure statements are truthful and non-misleading. Overseas, these activities are subject to foreign governmental regulation, which is in many respects similar to regulation in the United States but which vary from country to country. United States and foreign regulation continues to evolve, which could result in additional burdens on our SKINourishment business. If we fail to comply with applicable regulations we may be subject to, among other things, fines, suspension or withdrawal of regulatory approvals, product recalls, operating restrictions, and criminal prosecution. Additionally, the cost of maintaining personnel and systems necessary to comply with applicable regulations is substantial and increasing.
If the FDA or FTC disagrees with our characterization of our SKINourishment skincare products or product claims and determines that they are drug products, this could result in a variety of enforcement actions which could require the reformulation or relabeling of any such products, the submission of information in support of the products’ claims or the safety and effectiveness of any such products, or more punitive action, all of which could have a material adverse effect on the market price of our common stock and our business, financial condition and results of operations.
We may incur significant costs in order to comply with environmental remediation obligations.
Environmental laws also impose obligations on various entities to clean up contaminated properties or to pay for the cost of such remediation, often upon parties that did not actually cause the contamination. Accordingly, we may be liable, either contractually or by operation of law, for remediation costs even if the contaminated property is not presently owned or operated by us, is a landfill or other location where we have disposed wastes, or if the contamination was caused by third parties during or prior to our ownership or operation of the property. Given the nature of the past industrial operations conducted by us and others at these properties, there can be no assurance that all potential instances of soil or groundwater contamination have been identified, even for those properties where an environmental site assessment has been conducted. Future events, such as changes in existing laws or policies or their enforcement, or the discovery of currently unknown contamination, may give rise to additional remediation liabilities that may have a material adverse effect upon our business, results of operations or financial condition.
Risks Related to our Business
There are significant risks associated with acquiring and integrating businesses.
An element of our general growth strategy is the acquisition of or investment in businesses and assets that will diversify our current business, increase size, expand our geographic scope of operations and otherwise offer growth opportunities. We may not be able to successfully identify attractive acquisition or investment opportunities, obtain financing for acquisitions, make acquisitions on satisfactory terms, or successfully acquire and/or integrate identified targets. In identifying, evaluating and selecting a target business or assets for a potential acquisition or investment, we expect to encounter intense competition from other entities, including blank check companies, private equity groups, venture capital funds, leveraged buyout funds, and operating businesses seeking strategic acquisitions. Many of these entities are well-established and have extensive experience identifying and effecting business combinations directly or through affiliates. Moreover, many of these competitors possess greater financial, technical, human and other resources than us which will give them a competitive advantage in pursuing the acquisition of certain target businesses.
Our ability to implement our acquisition strategy is also subject to other risks and costs, including:
| · | loss of key employees, customers or suppliers of acquired businesses; |
| · | diversion of management’s time and attention from our core businesses; |
| · | adverse effects on existing business relationships with suppliers and customers; |
| · | our ability to secure necessary financing; |
| · | our ability to realize operating efficiencies, synergies, or other benefits expected from an acquisition; |
| · | risks associated with entering markets in which we have limited or no experience; |
| · | risks associated with our ability to execute successful due diligence; and |
| · | assumption of contingent or undisclosed liabilities of acquisition targets. |
17
Any of the above risks could have a material adverse effect on the market price of our common stock and our business, financial condition and results of operations.
Our previously announced growth strategy may negatively impact our business, financial condition and results of operations.
The Company announced that it is seeking to invest in high-quality, durable, cash flow-producing assets in order to diversify our business within the outdoor and consumer markets and potentially monetize our substantial net operating losses as part of our previously announced growth strategy. There can be no assurance as to the outcome of the growth strategy, that any particular acquisition or investment opportunities will be consummated, that any transaction will occur, or that our net operating losses will be monetized. In addition, our growth strategy may create perceived uncertainties as to our future direction and may result in the loss of employees, customers or business partners.
Turmoil across various sectors of the financial markets may negatively impact the Company’s business, financial condition, and/or operating results as well as our ability to effectively execute our growth strategy.
Various sectors of the credit markets and the financial services industry have experienced a period of unprecedented turmoil and upheaval characterized by disruption in the credit markets and availability of credit and other financing, the failure, bankruptcy, collapse or sale of various financial institutions and an unprecedented level of intervention from the United States federal government. While the future recurrence of these events cannot be predicted, they may have a material adverse effect on our ability to obtain financing necessary to effectively execute acquisitions, the ability of our customers and suppliers to continue to operate their businesses or the demand for our products, which could have a material adverse effect on the market price of our common stock and our business, financial condition, and results of operations.
We may not be able to adequately manage our growth.
We have expanded, and are seeking to continue to expand, our business. This growth has placed significant demands on our management, administrative, operating, and financial resources as well as our manufacturing capacity capabilities. The continued growth of our customer base, the types of products offered and the geographic markets served can be expected to continue to place a significant strain on our resources. Personnel qualified in the production and marketing of our products are difficult to find and hire, and enhancements of information technology systems to support growth are difficult to implement. Our future performance and profitability will depend in large part on our ability to attract and retain additional management and other key personnel, as well as our ability to increase and maintain our manufacturing capacity capabilities to meet the needs of our current and future customers. Any failure to adequately manage our growth could have a material adverse effect on the market price of our common stock and our business, financial condition, and results of operations.
Our credit agreement contains financial and restrictive covenants that may limit our ability to operate our business.
The credit agreement that we and certain of our subsidiaries entered into with JPMorgan Chase Bank, N.A. on May 3, 2019 (the “Credit Agreement”) contains, and any of our other future debt agreements may contain, covenant restrictions that limit our ability to operate our business, including, without limitation, restrictions on our and our subsidiaries’ ability to:
| · | incur additional debt or create liens; |
| · | engage in mergers, consolidations, certain divisions, liquidations or dissolutions other than in certain permitted instances described in the Credit Agreement; |
| · | substantially change the business conducted by us or our subsidiaries; and |
| · | pay dividends or make distributions or other restricted payments if certain conditions in the Credit Agreement are not fulfilled. |
In addition, the Credit Agreement contains other customary affirmative and negative covenants, including limitations on our and our subsidiaries’ ability to perform the following, subject to certain customary exceptions, qualifications and “baskets”: make certain investments, loans, advances, guarantees and acquisitions other than in certain permitted instances as described in the Credit Agreement; sell assets; prepay other indebtedness; engage in certain transactions with affiliates; enter into agreements that restrict dividends from subsidiaries or the ability of subsidiaries to grant liens upon their assets; amend certain charter documents and material agreements governing subordinated indebtedness; and deviate from certain financial ratios described further in the Credit Agreement.
18
As a result of these covenants, our ability to respond to changes in business and economic conditions and to obtain additional financing, if needed, may be significantly restricted, and we may be prevented from engaging in transactions or making acquisitions of a business that might otherwise be beneficial to us.
Our variable rate indebtedness subjects us to interest rate risk, which could cause our debt service obligations to increase significantly.
Our borrowings under our credit facility are at variable rates of interest and expose us to interest rate risk. If interest rates increase, our debt service obligations on the variable rate indebtedness would increase even though the amount borrowed remained the same, and our net income and cash flows would decrease.
Currency devaluations or fluctuations may significantly increase our expenses and affect our results of operations as well as the carrying value of international assets on our balance sheet, especially where the currency is subject to intense political and other outside pressures, such as in the case of the Euro, Canadian Dollar and Great British Pound.
While we transact business predominantly in U.S. dollars and most of our revenues are collected in U.S. dollars, a substantial portion of our assets, revenues, costs, and earnings are denominated in other currencies, such as the Euro, Canadian dollar, and Great British pound. Changes in the relation of these and other currencies to the U.S. dollar will affect the carrying value of our international assets as well as our sales and profitability and could result in exchange losses. For example, a devaluation of the Euro would negatively impact the carrying value of our assets in Europe and our results of operations because the earnings and assets in Europe would be reduced when translated into U.S. dollars.
Additionally, as the Company has substantial operations and assets located outside the United States, foreign operations expose us to foreign currency devaluations or fluctuations that could have a material adverse impact on our business, results of operations and financial condition based on the movements of the applicable foreign currency exchange rates in relation to the U.S. dollar, both for purposes of actual conversion and financial reporting purposes. The impact of future exchange rate devaluations or fluctuations on our results of operations cannot be accurately predicted. There can be no assurance that the U.S. dollar foreign exchange rates will be stable in the future or that fluctuations in financial or foreign markets will not have a material adverse effect on our business, results of operations, and financial condition.
Compliance with changing laws, regulations and standards of corporate governance and public disclosure may result in additional expenses.
Changing laws, regulations and standards relating to corporate governance and public disclosure, including the Sarbanes-Oxley Act of 2002 (the “Sarbanes Oxley Act”), the Dodd-Frank Wall Street Reform and Consumer Protection Act, new Securities and Exchange Commission regulations and NASDAQ rules, are creating uncertainty for companies such as ours. These new or changed laws, regulations, and standards are subject to varying interpretations, in many cases due to their lack of specificity. As a result, their application in practice may evolve over time as new guidance is provided by regulatory and governing bodies, which could result in continuing uncertainty regarding compliance matters and higher costs necessitated by ongoing revisions to disclosure and governance practices. We are committed to maintaining high standards of corporate governance and public disclosure. As a result, our efforts to comply with evolving laws, regulations, and standards have resulted in, and are likely to continue to result in, increased general and administrative expenses and a diversion of management time and attention from revenue-generating activities to compliance activities.
We could face particular challenges in maintaining and reporting on our internal control over financial reporting.
Section 404 of the Sarbanes-Oxley Act requires that we evaluate and report on our system of internal control over financial reporting and requires that we have our internal control over financial reporting audited. If we fail to maintain adequate internal controls, we could be subject to regulatory scrutiny, civil or criminal penalties and/or stockholder litigation. Any inability to provide reliable financial reports could harm our business and the trading price of our common stock. Section 404 of the Sarbanes-Oxley Act also requires that our independent registered public accounting firm report on the effectiveness of the Company’s internal control over financial reporting. In addition, acquisition targets may not be in compliance with the provisions of the Sarbanes-Oxley Act regarding adequacy of their internal controls. The development of the internal controls of any such entity to achieve compliance with the Sarbanes-Oxley Act may increase the time and costs necessary to complete any such acquisition.
If we identify any material weaknesses or significant deficiencies in our internal control over financial reporting, we may need to take costly steps to implement improved controls and may be subject to sanctions for failure to comply with the requirements of the Sarbanes-Oxley Act. Such remedial costs or sanctions could have a material adverse effect on our results of operations and financial condition. Further, we would be required to disclose any material weakness in internal control over financial reporting, and we would receive an adverse opinion on our internal control over financial reporting from our independent auditors. These factors could cause investors to lose confidence in our reported financial information and could have a negative effect on the trading price of our stock.
19
Breaches of our information systems could adversely affect our reputation, disrupt our operations, and result in increased costs and loss of revenue.
There have been an increasing number of global cyber security incidents affecting companies, which have caused operational failures or compromised sensitive or confidential corporate and personal data. Because we are interconnected with and dependent on third-party vendors, we could be adversely affected if any of them are subject to a successful cyber attack or other information security event. Although we do not believe our, or our vendors’, systems are at a greater risk of cyber security incidents than other comparable companies, such cyber security incidents may result in the loss or compromise of customer, financial, or operational data; disruption of billing, collections, or normal operating activities; disruption of electronic monitoring and control of operational systems; and delays in financial reporting and other management functions, and our acquisition activities could increase such risk. Possible impacts associated with a cyber security incident may include, among other things, remediation costs related to lost, stolen, or compromised data; repairs to data processing systems; increased cyber security protection costs; reputational damage; and adverse effects on our compliance with privacy and other laws and regulations that are applicable to us. We have obtained insurance coverage that protects us against losses from certain cyber security incidents, including liability for third-party vendors who mishandle our information. However, there can be no guarantee that every potential loss due to cyber-attack or theft of information has been insured against, nor that the limits of the insurance we have acquired will be sufficient to cover all such losses.
Interruptions in the proper functioning of our information systems or other issues with our enterprise resource planning systems could cause disruption to our operations.
We heavily rely on our information systems to manage our various business operations, including our ordering, pricing, billing, inventory management, supply chain, accounting and other processes. Our systems may be subject to damage or interruption from a variety of sources, including power outages, computer and telecommunications failures, computer viruses, cyber security breaches, vandalism, severe weather conditions, catastrophic events, terrorism, and human error. Although we do maintain disaster recovery measures in place which we believe to be adequate, we cannot assure you that our disaster recovery measures can account for all eventualities. If our systems are damaged, fail to function properly, or otherwise become compromised or unavailable, we may incur substantial costs to repair or replace them, and we may experience loss of critical data and interruptions or delays in our ability to perform critical functions, which could adversely affect our business, results of operations and financial condition.
Our information technology systems require periodic modifications, upgrades, and replacement that subject us to costs and risks, including potential disruption to our internal control structure, substantial capital expenditures, additional administration and operating expenses, retention of sufficiently skilled personnel or outside firms to implement and operate existing or new systems, and other risks and costs of delays or difficulties in transitioning to new or modified systems or of integrating new or modified systems into our current systems. In addition, challenges implementing new or modified technology systems may cause disruptions in our business operations and have an adverse effect on our business operations if not anticipated and appropriately mitigated.
Our Board of Directors and executive officers have significant influence over our affairs.
The members of our Board of Directors and our executive officers, which includes Mr. Warren B. Kanders, beneficially own approximately 28% of our outstanding common stock as of March 4, 2020. As a result, our Board of Directors and executive officer, to the extent they vote their shares in a similar manner, have influence over our affairs and could exercise such influence in a manner that is not in the best interests of our other stockholders, including by attempting to delay, defer or prevent a change of control transaction that might otherwise be in the best interests of our stockholders.
We may be unable to realize the benefits of our net operating losses and tax credit carryforwards.
Net operating losses (“NOLs”) may be carried forward to offset federal and state taxable income in future years and eliminate income taxes otherwise payable on such taxable income, subject to certain adjustments. Based on current federal corporate income tax rates, our NOL and other carryforwards could provide a benefit to us, if fully utilized, of significant future tax savings. However, our ability to use these tax benefits in future years will depend upon the amount of our otherwise taxable income. If we do not have sufficient taxable income in future years to use the tax benefits before they expire, we will lose the benefit of these NOL carryforwards permanently.
Additionally, if we underwent an ownership change, the NOL carryforward limitations would impose an annual limit on the amount of the taxable income that may be offset by our NOL generated prior to the ownership change. If an ownership change were to occur, we may be unable to use a significant portion of our NOL to offset taxable income. In general, an ownership change occurs when, as of any testing date, the aggregate of the increase in percentage points of the total amount of a corporation’s stock owned by one or more “5-percent shareholders” within the meaning of Section 382 of the Internal Revenue Code (“Code”) whose percentage ownership of the stock has increased as of such date over the aggregate of the lowest percentage of the stock owned by such 5-percent shareholder at any time during the three-year period preceding such date is more than 50 percentage points. In general, persons who own 5% or more of a corporation’s stock are 5-percent shareholders, and all stock owned by persons who are not 5-percent shareholders is treated as owned by one 5-percent shareholder. The issuance of a large number of shares of common stock in connection with any acquisitions could result in a limitation of the use of our NOLs.
20
Further, our certificate of incorporation provides for blank check preferred stock, which allows the Board to issue preferred stock at any time with rights and designations set forth by the Board. Section 382 of the Code generally excludes preferred stock when calculating ownership percentages as they relate to our NOLs if the preferred stock satisfies all of the following criteria: it is not entitled to vote, it is limited and preferred as to dividends and does not participate in corporate growth to any significant extent, it has redemption and liquidation rights which do not exceed the issue price of such stock (except for a reasonable redemption or liquidation premium), and it is not convertible into another class of stock. Our Board may authorize and issue preferred stock that does not meet these criteria, and such preferred stock would count towards determining ownership change under Section 382 of the Code. Therefore the issuance of any preferred stock could increase the likelihood of a limitation of the use of our NOLs.
Moreover, if a corporation experiences an ownership change and does not satisfy the continuity of business enterprise, or COBE, requirement (which generally requires that the corporation continue its historic business or use a significant portion of its historic business assets in a business for the two-year period beginning on the date of the ownership change), it cannot, subject to certain exceptions, use any NOL from a pre-change period to offset taxable income in post-change years.
The actual ability to utilize the tax benefit of any existing NOLs will be subject to future facts and circumstances with respect to meeting the above described COBE requirements at the time NOLs are being utilized on a tax return. The realization of NOLs and the recognition of asset and valuation allowances for deferred taxes require management to make estimates and judgments about the Company’s future profitability which are inherently uncertain. Deferred tax assets are reduced by a valuation allowance when, in the opinion of management, it is more likely than not that some portion or all of the deferred tax assets will not be realized. If, in the opinion of management, it becomes more likely than not that some portion or all of the deferred tax assets will not be realized, deferred tax assets would be reduced by a valuation allowance and any such reduction could have a material adverse effect on the financial condition of the Company.
The amount of NOL and tax credit carryforwards that we have claimed has not been audited or otherwise validated by the U.S. Internal Revenue Service (the “IRS”). The IRS could challenge our calculation of the amount of our NOL or our determinations as to when a prior change in ownership occurred, and other provisions of the Code may limit our ability to carry forward our NOL to offset taxable income in future years. If the IRS were successful with respect to any such challenge, the potential tax benefit of the NOL carryforwards to us could be substantially reduced.
Certain protective measures implemented by us to preserve our NOL may not be effective or may have some unintended negative effects.
On July 24, 2003, at our Annual Meeting of Stockholders, our stockholders approved an amendment (the “Amendment”) to our Amended and Restated Certificate of Incorporation to restrict certain acquisitions of our securities in order to help assure the preservation of our NOL. The Amendment generally restricts direct and indirect acquisitions of our equity securities if such acquisition will affect the percentage of the Company’s capital stock that is treated as owned by a “5% stockholder.” Additionally, on February 7, 2008, our Board of Directors approved a rights agreement which is designed to assist in limiting the number of 5% or more owners and thus reduce the risk of a possible “change of ownership” under Section 382 of the Code.
Although the transfer restrictions imposed on our capital stock and the rights agreement are intended to reduce the likelihood of an impermissible ownership change, there is no guarantee that such protective measures would prevent all transfers that would result in an impermissible ownership change. These protective measures also will require any person attempting to acquire a significant interest in us to seek the approval of our Board of Directors. This may have an “anti-takeover” effect because our Board of Directors may be able to prevent any future takeover. Similarly, any limits on the amount of capital stock that a stockholder may own could have the effect of making it more difficult for stockholders to replace current management. Additionally, because protective measures implemented by us to preserve our NOL will have the effect of restricting a stockholder’s ability to acquire our common stock, the liquidity and market value of our common stock might suffer.
The loss of any member of our senior management or certain other key executives could significantly harm our business.
Our ability to maintain our competitive position is dependent to a large degree on the efforts and skills of our senior management team, including Warren B. Kanders. If we were to lose the services of any member of our senior management, our business may be significantly impaired. In addition, many of our senior executives have strong industry reputations, which aid us in identifying acquisition and borrowing opportunities, and having such opportunities brought to us. The loss of the services of these key personnel could materially and adversely affect our operations because of diminished relationships with lenders, existing and prospective tenants, property sellers and industry personnel.
21
Our Board of Directors may change significant corporate policies without stockholder approval.
Our investment, financing, borrowing and dividend policies and our policies with respect to all other activities, including growth, debt, capitalization and operations, will be determined by our Board of Directors. These policies may be amended or revised at any time and from time to time at the discretion of the Board of Directors without a vote of our stockholders. In addition, the Board of Directors may change our policies with respect to conflicts of interest provided that such changes are consistent with applicable legal requirements. A change in these policies could have an adverse effect on our financial condition, results of operations, cash flow, per share trading price of our common stock and ability to satisfy our debt service obligations and to pay dividends to our stockholders.
Compensation awards to our management may not be tied to or correspond with our improved financial results or share price.
The compensation committee of our Board of Directors is responsible for overseeing our compensation and employee benefit plans and practices, including our executive compensation plans and our incentive compensation and equity-based compensation plans. Our compensation committee has significant discretion in structuring compensation packages and may make compensation decisions based on any number of factors. As a result, compensation awards may not be tied to or correspond with improved financial results for the Company or the share price of our common stock.
Risks Related to our Common Stock
Our Amended and Restated Certificate of Incorporation authorizes the issuance of shares of preferred stock.
Our Amended and Restated Certificate of Incorporation provides that our Board of Directors will be authorized to issue from time to time, without further stockholder approval, up to 5,000,000 shares of preferred stock in one or more series and to fix or alter the designations, preferences, rights and any qualifications, limitations or restrictions of the shares of each series, including the dividend rights, dividend rates, conversion rights, voting rights, terms of redemption, including sinking fund provisions, redemption price or prices, liquidation preferences and the number of shares constituting any series or designations of any series. Such shares of preferred stock could have preferences over our common stock with respect to dividends and liquidation rights. We may issue additional preferred stock in ways which may delay, defer or prevent a change in control of the Company without further action by our stockholders. Such shares of preferred stock may be issued with voting rights that may adversely affect the voting power of the holders of our common stock by increasing the number of outstanding shares having voting rights, and by the creation of class or series voting rights.
Our payment of future quarterly dividends on our common stock is subject to the discretion and approval of our Board of Directors.
On August 6, 2018, the Company announced that its Board of Directors approved the initiation of a quarterly cash dividend program of $0.025 per share of the Company’s common stock (the “Quarterly Cash Dividend”) or $0.10 per share on an annualized basis. While we intend to pay regular Quarterly Cash Dividends for the foreseeable future, all subsequent dividends will be reviewed quarterly and declared at the discretion and approval of our Board of Directors and will depend upon, among other things, our results of operations, capital requirements, general business conditions, contractual restrictions under our credit facility on the payment of dividends, legal and regulatory restrictions on the payment of dividends, and other factors our Board of Directors deems relevant. Therefore, you should not purchase our common stock if you need immediate or future income by way of dividends from your investment. In addition, upon an event of default under our credit facility, we are prohibited from declaring or paying any dividends on our common stock or generally making other distributions to our stockholders.
Shares of our common stock have been, and may continue to be, thinly traded, which may contribute to volatility in our stock price and less liquidity for investors.
The trading volume of our common stock has varied, and at times may be characterized as thinly traded. As a result of this thin trading market or “float” for our common stock, our common stock has been, and may continue to be, less liquid than the common stock of companies with broader public ownership. If our common stock is thinly traded, the trading of a relatively small volume of our common stock may have a greater impact on the trading price of our common stock than would be the case if our float were larger. As a result, the trading prices of our common stock may be more volatile than the common stock of companies with broader public ownership, and an investor to be unable to liquidate an investment in our common stock at attractive prices.
We cannot predict the prices at which our common stock will trade in the future. Variations in financial results, announcements of material events, changes in our dividend policy, technological innovations or new products by us or our competitors, our quarterly operating results, changes in general conditions in the economy or the outdoor and consumer industries, other developments affecting us or our competitors or general price and volume fluctuations in the market are among the many factors that could cause the market price of our common stock to fluctuate substantially.
22
The sale of a substantial amount of our common stock in the public market could adversely affect the prevailing market price of our common stock.
We have outstanding an aggregate of 29,759,620 shares of our common stock as of March 4, 2020. This includes 6,918,252 shares of common stock that are beneficially owned by Mr. Kanders, our Chairman of the Board, of which he has 5,328,045 hypothecated and/or pledged as security for loans from financial institutions, which hypothecation has been in place for over ten years, and that may be sold by such financial institutions in the event of a foreclosure of these loans. The sale of a significant amount of shares at any given time, or the perception that such sales could occur, including sales of the shares beneficially owned by Mr. Kanders, could adversely affect the prevailing market price of our common stock.
We may issue a substantial amount of our common stock in the future, which could cause dilution to current investors and otherwise adversely affect our stock price.
We may issue additional shares of common stock as consideration for such acquisition. These issuances could be significant. To the extent that we make acquisitions and issue our shares of common stock as consideration, your equity interest in us will be diluted. Any such issuance will also increase the number of outstanding shares of common stock that will be eligible for sale in the future. Persons receiving shares of our common stock in connection with these acquisitions may be more likely to sell off their common stock, which may influence the price of our common stock. In addition, the potential issuance of additional shares in connection with anticipated acquisitions could lessen demand for our common stock and result in a lower price than might otherwise be obtained. We may issue common stock in the future for other purposes as well, including in connection with financings, for compensation purposes, in connection with strategic transactions or for other purposes. The issuance of a large number of shares of common stock in connection with an acquisition could also have a negative effect on our ability to use our NOLs.
ITEM 1B. UNRESOLVED STAFF COMMENTS
None.
Our corporate headquarters, as well as our primary research, evaluation and design studios, is located in a facility owned by the Company in Salt Lake City, Utah. In addition, at December 31, 2019, the Company and its subsidiaries lease or own facilities throughout the U.S. and Europe. In general, our properties are well maintained, considered adequate and being utilized for their intended purposes.
The following table identifies and provides certain information regarding our principal facilities:
| Activity | Location | Owned/Leased | ||
| Black Diamond Segment | ||||
| Corporate Headquarters: | Salt Lake City, Utah | Owned | ||
| Black Diamond U.S. Distribution and Manufacturing Facilities: | Salt Lake City, Utah | Leased/Owned | ||
| Black Diamond European Sales and Marketing Office: | Innsbruck, Austria | Leased | ||
| PIEPS Sales and Marketing Office: | Lebring, Austria | Leased | ||
| Sierra Segment | ||||
| Sierra U.S. Distribution and Manufacturing Facilities: | Sedalia, Missouri | Owned |
Legal Proceedings
The Company is involved in various legal disputes and other legal proceedings that arise from time to time in the ordinary course of business. Based on currently available information, the Company does not believe that the disposition of any of the legal disputes the Company or its subsidiaries is currently involved in will have a material adverse effect upon the Company’s consolidated financial condition, results of operations or cash flows. It is possible that, as additional information becomes available, the impact on the Company of an adverse determination could have a different effect.
23
Litigation
The Company is involved in various lawsuits arising from time to time that the Company considers ordinary routine litigation incidental to its business. Amounts accrued for litigation matters represent the anticipated costs (damages and/or settlement amounts) in connection with pending litigation and claims and related anticipated legal fees for defending such actions, which legal fees are expensed as incurred. The costs are accrued when it is both probable that a liability has been incurred and the amount can be reasonably estimated. The accruals are based upon the Company’s assessment, after consultation with counsel (if deemed appropriate), of probable loss based on the facts and circumstances of each case, the legal issues involved, the nature of the claim made, the nature of the damages sought and any relevant information about the plaintiffs and other significant factors that vary by case. When it is not possible to estimate a specific expected cost to be incurred, the Company evaluates the range of probable loss and records the minimum end of the range. Based on currently available information, the Company does not believe that it is reasonably possible that the disposition of any of the legal disputes the Company or its subsidiaries is currently involved in will have a material adverse effect upon the Company’s consolidated financial condition, results of operations or cash flows. There is a reasonable possibility of loss from contingencies in excess of the amounts accrued by the Company in the accompanying consolidated balance sheets; however, the actual amounts of such possible losses cannot currently be reasonably estimated by the Company at this time. It is possible that, as additional information becomes available, the impact on the Company could have a different effect.
Product Liability
As a consumer goods manufacturer and distributor, the Company faces the risk of product liability and related lawsuits involving claims for substantial money damages, product recall actions and higher than anticipated rates of warranty returns or other returns of goods. The Company is therefore vulnerable to various personal injury and property damage lawsuits relating to its products and incidental to its business.
Based on current information, there are no pending product liability claims and lawsuits of the Company, which the Company believes in the aggregate, will have a material adverse effect on the Company’s consolidated financial position, results of operations or cash flows.
ITEM 4. MINE SAFETY DISCLOSURES
Not applicable.
24
ITEM 5. MARKET FOR REGISTRANT’S COMMON EQUITY, RELATED STOCKHOLDER MATTERS AND ISSUER PURCHASES OF EQUITY SECURITIES
Our common stock is listed for trading on NASDAQ Global Select Market under the trading symbol “CLAR”.
Performance Graph
Set forth below is a line graph comparing the yearly percentage change in the cumulative total stockholder return on our common stock to the cumulative total return of the NASDAQ Global Select Market Composite and the Russell 2000 Index for the period commencing on December 31, 2014 and ending on December 31, 2019 (the “Measuring Period”). The graph assumes that the value of the investment in our common stock and the indexes was $100 on December 31, 2014. The yearly change in cumulative total return is measured by dividing (1) the sum of (i) the cumulative amount of dividends for the Measuring Period, assuming dividend reinvestment, and (ii) the change in share price between the beginning and end of the Measuring Period, by (2) the share price at the beginning of the Measuring Period.
Historical stock price performance should not be relied on as indicative of future stock price performance.
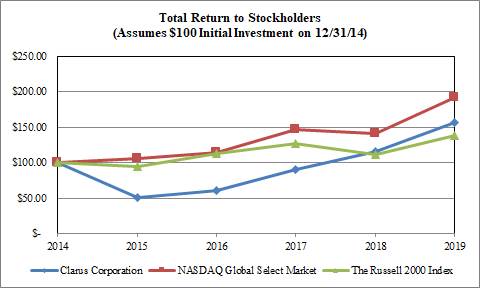
Total Return Analysis
| 12/31/2014 | 12/31/2015 | 12/31/2016 | 12/31/2017 | 12/31/2018 | 12/31/2019 | |||||||||||||||||||
| Clarus Corporation | $ | 100.00 | $ | 50.51 | $ | 61.14 | $ | 89.71 | $ | 116.23 | $ | 156.89 | ||||||||||||
| The Russell 2000 Index | $ | 100.00 | $ | 94.29 | $ | 112.65 | $ | 127.46 | $ | 111.94 | $ | 138.50 | ||||||||||||
| NASDAQ Global Select Market | $ | 100.00 | $ | 106.11 | $ | 114.16 | $ | 146.62 | $ | 141.23 | $ | 191.51 | ||||||||||||
Stockholders
On March 4, 2020, the last reported sales price for our common stock was $12.17 per share. As of March 4, 2020, there were 78 holders of record of our common stock.
Dividends
On August 6, 2018, the Company announced that its Board of Directors approved the initiation of a quarterly cash dividend program of $0.025 per share of the Company’s common stock (the “Quarterly Cash Dividend”) or $0.10 per share on an annualized basis. In 2019 and 2018, our total Quarterly Cash Dividends were $2,987,000 and $1,488,000, respectively. On January 24, 2020, the Company announced that its Board of Directors approved the payment on February 14, 2020 of the Quarterly Cash Dividend to the record holders of shares of the Company’s common stock as of the close of business on February 3, 2020. The payment of any future Quarterly Cash Dividends will be at the discretion of our Board of Directors and will depend upon, among other things, our results of operations, capital requirements, general business conditions, contractual restrictions on payment of dividends, if any, legal and regulatory restrictions on the payment of dividends, and other factors our Board of Directors deems relevant.
25
Recent Sales of Unregistered Securities
None.
Recent Purchases of our Registered Equity Securities
On November 9, 2015, the Company announced that its Board of Directors authorized a stock repurchase program that allows the repurchase of up to $30,000,000 of the Company’s outstanding common stock. No repurchases of shares of the Company’s common stock occurred during the three months ended December 31, 2019.
Securities Authorized for Issuance Under Equity Compensation Plans
The following table sets forth certain information regarding our equity plans as of December 31, 2019:
| Plan Category | (A) Number of securities to be issued upon exercise of outstanding, warrants and rights | (B) Weighted-average exercise price of outstanding options, warrants and rights | (C) Number of securities remaining available for future issuance under equity compensation plans (excluding securities reflected in column (A)) | |||||||||
| Equity compensation plans approved by security holders (1) | 3,711,000 | $ | 8.67 | 6,654,612 | ||||||||
| Equity compensation plans not approved by security holders (2) (3) | 800,000 | $ | 8.75 | - | ||||||||
| Total | 4,511,000 | $ | 8.69 | 6,654,612 | ||||||||
(1) Consists of stock options and restricted stock awards issued and issuable under the 2005 Stock Incentive Plan and the 2015 Stock Incentive Plan.
(2) Includes stock options granted to the Company’s Executive Chairman Warren B. Kanders on December 23, 2002 to purchase 400,000 shares of common stock, having an exercise price of $7.50 per share and an expiration date of December 20, 2020.
(3) Includes stock options granted to the Company’s Executive Chairman Warren B. Kanders on December 23, 2002 to purchase 400,000 shares of common stock, having an exercise price of $10.00 per share and an expiration date of December 20, 2020.
26
ITEM 6. SELECTED FINANCIAL DATA
Our selected financial information set forth below has been derived from our audited consolidated financial statements and should be read in conjunction with our consolidated financial statements, including the notes thereto and “Management’s Discussion and Analysis of Financial Condition and Results of Operations” of Item 7 of Part II of this Annual Report on Form 10-K. On October 7, 2015, the Company completed the sale of POC. The activities of POC have been segregated and reported as discontinued operations for all periods presented. On August 21, 2017, the Company acquired Sierra. On November 6, 2018, the Company acquired the assets of SKINourishment. See Note 2. Acquisition to the notes to consolidated financial statements.
| Year Ended December 31, | ||||||||||||||||||||
| 2019 | 2018 | 2017 | 2016 | 2015 | ||||||||||||||||
| (in thousands, except per share amounts) | ||||||||||||||||||||
| Statement of Operations Data: | ||||||||||||||||||||
| Sales | $ | 229,437 | $ | 212,141 | $ | 170,687 | $ | 148,189 | $ | 155,266 | ||||||||||
| Gross profit | 80,291 | 73,962 | 53,810 | 43,684 | 54,246 | |||||||||||||||
| Income (loss) from continuing operations | 18,972 | 7,301 | (673 | ) | (8,978 | ) | (88,106 | ) | ||||||||||||
| Net income (loss) | 18,972 | 7,301 | (673 | ) | (8,978 | ) | (77,542 | ) | ||||||||||||
| Income (loss) from continuing operations per share: | ||||||||||||||||||||
| Basic | $ | 0.64 | $ | 0.24 | $ | (0.02 | ) | $ | (0.30 | ) | $ | (2.70 | ) | |||||||
| Diluted | 0.61 | 0.24 | (0.02 | ) | (0.30 | ) | (2.70 | ) | ||||||||||||
| Income from discontinued operations per share: | ||||||||||||||||||||
| Basic | - | - | - | - | 0.32 | |||||||||||||||
| Diluted | - | - | - | - | 0.32 | |||||||||||||||
| Net income (loss) per share: | ||||||||||||||||||||
| Basic | 0.64 | 0.24 | (0.02 | ) | (0.30 | ) | (2.38 | ) | ||||||||||||
| Diluted | 0.61 | 0.24 | (0.02 | ) | (0.30 | ) | (2.38 | ) | ||||||||||||
| Cash dividends declared per share | $ | 0.10 | $ | 0.05 | $ | - | $ | - | $ | - | ||||||||||
| Weighted average common shares outstanding for earnings per share: | ||||||||||||||||||||
| Basic | 29,820 | 29,915 | 30,022 | 30,397 | 32,600 | |||||||||||||||
| Diluted | 30,993 | 30,255 | 30,022 | 30,397 | 32,600 | |||||||||||||||
| December 31, | ||||||||||||||||||||
| 2019 | 2018 | 2017 | 2016 | 2015 | ||||||||||||||||
| Balance Sheet Data: | ||||||||||||||||||||
| Total current assets | $ | 120,872 | $ | 108,501 | $ | 99,444 | $ | 166,945 | $ | 180,581 | ||||||||||
| Total assets | 230,265 | 213,128 | 207,449 | 210,457 | 226,792 | |||||||||||||||
| Long-term obligations, net of current | 24,509 | 25,183 | 24,683 | 9,042 | 30,914 | |||||||||||||||
| Total liabilities | 49,073 | 46,923 | 44,467 | 49,649 | 52,360 | |||||||||||||||
| Total stockholders' equity | 181,192 | 166,205 | 162,982 | 160,808 | 174,432 | |||||||||||||||
The gross profit for the years ended December 31, 2018 and 2017, included additional costs of $1,049 and $2,098, respectively, related to the sale of Sierra inventory that was recorded at fair value in purchase accounting.
The loss from continuing operations for the year ended December 31, 2015, included an impairment of goodwill of $29,507 and the recognition of a valuation allowance on the Company’s deferred tax assets of $48,858.
27
ITEM 7. MANAGEMENT’S DISCUSSION AND ANALYSIS OF FINANCIAL CONDITION AND RESULTS OF OPERATIONS
Forward-Looking Statements
Please note that in this Annual Report on Form 10-K Clarus Corporation (which may be referred to as the “Company,” “Clarus,” “we,” “our” or “us”) may use words such as “appears,” “anticipates,” “believes,” “plans,” “expects,” “intends,” “future,” and similar expressions which constitute forward-looking statements within the meaning of the safe harbor provisions of the Private Securities Litigation Reform Act of 1995. Forward-looking statements are made based on our expectations and beliefs concerning future events impacting the Company and therefore involve a number of risks and uncertainties. We caution that forward-looking statements are not guarantees and that actual results could differ materially from those expressed or implied in the forward-looking statements.
Potential risks and uncertainties that could cause the actual results of operations or financial condition of the Company to differ materially from those expressed or implied by forward-looking statements in this Annual Report on Form 10-K include, but are not limited to, the overall level of consumer demand on our products; general economic conditions and other factors affecting consumer confidence, preferences, and behavior; disruption and volatility in the global currency, capital and credit markets; the financial strength of the Company’s customers; the Company’s ability to implement its business strategy; the ability of the Company to execute and integrate acquisitions; changes in governmental regulation, legislation or public opinion relating to the manufacture and sale of bullets and ammunition by our Sierra segment, and the possession and use of firearms and ammunition by our customers; the Company’s exposure to product liability or product warranty claims and other loss contingencies; stability of the Company’s manufacturing facilities and suppliers, including in light of disease epidemics and health-related concerns such as the coronavirus; the impact that global climate change trends may have on the Company and its suppliers and customers; the Company’s ability to protect patents, trademarks and other intellectual property rights; any breaches of, or interruptions in, our information systems; fluctuations in the price, availability and quality of raw materials and contracted products as well as foreign currency fluctuations; our ability to utilize our net operating loss carryforwards; changes in tax laws and liabilities, tariffs, legal, regulatory, political and economic risks; and the Company’s ability to maintain a quarterly dividend. More information on potential factors that could affect the Company’s financial results can be found under Item 1A.—Risk Factors of this Annual Report on Form 10-K. All forward-looking statements included in this Annual Report on Form 10-K are based upon information available to the Company as of the date of this Annual Report on Form 10-K, and speak only as the date hereof. We assume no obligation to update any forward-looking statements to reflect events or circumstances after the date of this Annual Report on Form 10-K.
Overview
Headquartered in Salt Lake City, Utah, Clarus, a company focused on the outdoor and consumer industries, is seeking opportunities to acquire and grow businesses that can generate attractive shareholder returns. The Company has net operating tax loss carryforwards which it is seeking to redeploy to maximize shareholder value. Clarus’ primary business is as a leading designer, developer, manufacturer and distributor of outdoor equipment and lifestyle products focused on the climb, ski, mountain, sport and skincare markets. The Company’s products are principally sold under the Black Diamond®, Sierra®, PIEPS® and SKINourishment® brand names through outdoor specialty and online retailers, distributors and original equipment manufacturers throughout the U.S. and internationally.
Through our Black Diamond, PIEPS, and SKINourishment brands, we offer a broad range of products including: high-performance, activity-based apparel (such as shells, insulation, midlayers, pants and logowear); rock-climbing footwear and equipment (such as carabiners, protection devices, harnesses, belay devices, helmets, and ice-climbing gear); technical backpacks and high-end day packs; trekking poles; headlamps and lanterns; gloves and mittens; and skincare and other sport-enhancing products. We also offer advanced skis, ski poles, ski skins, and snow safety products, including avalanche airbag systems, avalanche transceivers, shovels, and probes. Through our Sierra brand, we manufacture a wide range of high-performance bullets and ammunition for both rifles and pistols that are used for precision target shooting, hunting and military and law enforcement purposes.
Clarus Corporation, incorporated in Delaware in 1991, acquired Black Diamond Equipment, Ltd. (“Black Diamond Equipment”) in May 2010 and changed its name to Black Diamond, Inc. in January 2011. In October 2012, we acquired PIEPS Holding GmbH and its subsidiaries (collectively, “PIEPS”).
On August 14, 2017, the Company changed its name from Black Diamond, Inc. to Clarus Corporation and its stock ticker symbol from “BDE” to “CLAR” on the NASDAQ stock exchange. On August 21, 2017, the Company acquired Sierra Bullets, L.L.C. (“Sierra”). On November 6, 2018, the Company acquired the assets of SKINourishment, Inc. (“SKINourishment”).
On May 7, 2018, the Company announced a “modified Dutch auction” tender offer for Clarus’ common stock, as well as the preferred share purchase rights associated with such shares (collectively, the “Shares”). On July 11, 2018, the tender offer expired, following which the Company announced it would accept 417,237 Shares for purchase at a price of $8.00 per Share, for an aggregate cost of approximately $3,338,000, excluding fees and expenses.
28
On August 6, 2018, the Company announced that its Board of Directors approved the initiation of a quarterly cash dividend program of $0.025 per share of the Company’s common stock (the “Quarterly Cash Dividend”) or $0.10 per share on an annualized basis. In 2019 and 2018, our total Quarterly Cash Dividends were $2,987,000 and $1,488,000, respectively. On January 24, 2020, the Company announced that its Board of Directors approved the payment on February 14, 2020 of the Quarterly Cash Dividend to the record holders of shares of the Company’s common stock as of the close of business on February 3, 2020.
Critical Accounting Policies and Use of Estimates
Management’s discussion of our financial condition and results of operations is based on the consolidated financial statements, which have been prepared in accordance with U.S. generally accepted accounting principles (“GAAP”). The preparation of the consolidated financial statements requires us to make estimates and assumptions that affect the reported amounts of assets and liabilities and disclosure of contingent liabilities at the date of the consolidated financial statements. Estimates also affect the reported amounts of revenues and expenses during the reporting periods. We continually evaluate our estimates and assumptions including those related to derivatives, revenue recognition, income taxes and valuation of long-lived assets, goodwill and other intangible assets. We base our estimates on historical experience and other assumptions that are believed to be reasonable under the circumstances. Actual results could differ from these estimates.
We believe the following critical accounting policies include the more significant estimates and assumptions used in the preparation of our consolidated financial statements. Our accounting policies are more fully described in Note 1 of our consolidated financial statements.
| · | We allocate the purchase price of acquired companies to the tangible and intangible assets acquired and liabilities assumed based on their estimated fair values. The excess of the purchase price over these fair values is recorded as goodwill. We engage independent third-party valuation specialists to assist us in determining the fair values of certain assets acquired and liabilities assumed. Such valuations require management to make significant estimates and assumptions, especially with respect to intangible assets. Different valuations approaches are used to value different types of intangible assets. The income approach is a valuation technique that capitalizes anticipated income associated with the asset being valued. This approach is predicated on developing net income and cash flow projections which are discounted for risk and the time value of money. This approach is generally the principal approach to the valuation of most intangible assets. The market approach involves the compilation and analysis of recent acquisitions of similar assets in the open market. A fair value can be estimated after adjustments are made to reflect comparability differences between the assets sold and those being valued. This method of valuation applies primarily to the valuation of owned land and certain intangible assets. The cost approach estimates the amount that would be required to replace the service capacity of an asset (often referred to as current replacement cost). We typically apply all three approaches to estimate the fair value of our tangible and intangible tangible assets depending on the type of asset acquired.
Significant estimates in valuing certain intangible assets include but are not limited to the projected financial information related to each individual asset, particularly forecasted revenue growth rates, market-based royalty rates and estimated discount rates. The relief-from-royalty method is used to estimate the cost savings that accrue to the owner of an intangible asset who would otherwise have to pay royalties or license fees on revenues earned through the use of the asset. Our discounted cash flow estimates use discount rates that correspond to a weighted-average cost of capital consistent with a market-participant view. The discount rates are consistent with those used for investment decisions and take into account our operating plans and strategies. Management’s estimates of fair value are based upon assumptions believed to be reasonable, but which are inherently uncertain and unpredictable. If we do not achieve the results reflected in the assumptions and estimates, our goodwill impairment evaluations could be adversely affected, and we may impair a portion or all of our intangible assets, which would adversely affect our operating results in the period of impairment. |
| · | We account for income taxes using the asset and liability method. The asset and liability method provides that deferred tax assets and liabilities are recognized for the expected future tax consequences of temporary differences between the financial reporting and tax bases of assets and liabilities, and for operating loss and tax credit carryforwards. We may make assumptions, judgments and estimates in order to determine the future taxable income available to support the recoverability of deferred tax assets at a more-likely-than-not threshold. The sources of future taxable income include 1) future reversal of existing taxable temporary differences, 2) taxable income in carryback years if carryback is permitted, 3) future taxable income from future operations, and 4) tax planning strategies. The degree and subjectivity and judgment increases as the source of future taxable income becomes more inherently subjective. Our assumptions, judgments and estimates relative to the realizability of a deferred tax asset take into account predictions of the amount and category of expected future taxable income. Actual operating results and the underlying amount and category of income in future years could cause our current assumptions, judgments and estimates of recoverable net deferred taxes to be inaccurate. Changes in any of the assumptions, judgments and estimates mentioned above related to the realizability of deferred tax assets, could materially affect our financial position and results of operations. |
29
· | We assess the recoverability of our one reporting unit’s carrying value of goodwill by performing
a qualitative assessment and/or a quantitative goodwill impairment test. At a minimum, we perform an annual assessment of
possible goodwill impairment as of each December 31. Management may perform an interim goodwill impairment assessment whenever
events or circumstances make it more-likely-than-not that an impairment may have occurred, such as a significant adverse change
in the business climate or a decision to sell or dispose of the reporting unit. If we begin with a qualitative assessment and are
able to support the conclusion that it is not more-likely-than-not that the fair value of the reporting unit is less than its carrying
value, we are not required to perform the quantitative goodwill impairment test. Otherwise, we are required to perform the
quantitative goodwill impairment test which compares the reporting unit’s carrying value including goodwill to its estimated
fair value. We estimate the reporting unit’s fair value using either the income approach based upon projected discounted
cash flows of the reporting unit or the market approach based upon comparable market acquisition transactions. If the estimated
fair value of the reporting entity exceeds the carrying value, the goodwill is not impaired, and no further review is required.
However, if the carrying value exceeds the estimated fair value of the reporting unit, an impairment expense should be recognized
for the excess of the carrying value over the fair value.
Under the income approach, the estimated discounted cash flows are based on the best information available to us at the time, including supportable assumptions and projections we believe are reasonable. Our discounted cash flow estimates use discount rates that correspond to a weighted-average cost of capital consistent with a market-participant view. The discount rates are consistent with those used for investment decisions and take into account our operating plans and strategies. Certain other key assumptions utilized, including revenue projections, costs of goods sold, operating expenses and effective tax rates, are based on estimates consistent with those utilized in our annual budgeting and planning process that we believe are reasonable. However, if we do not achieve the results reflected in the assumptions and estimates, our goodwill impairment evaluations could be adversely affected, and we may impair a portion or all of our goodwill, which would adversely affect our operating results in the period of impairment.
The market approach identifies the EBITDA multiples of recent industry and competitor acquisitions. The reporting unit’s current EBITDA is multiplied by the median industry and competitor acquisition market multiple to estimate its current estimated fair value. If the market multiples or EBITDA value assumptions are incorrect, our goodwill impairment evaluation could also be adversely affected, and we may impair a portion or all of our goodwill, which would adversely affect our operating results in the period of impairment. As a result of the current wide swings in market multiples resulting from industry acquisitions, management believes that the income approach provides for a more accurate estimate of the reporting unit’s fair value.
No impairment was recorded during the years ended December 31, 2019, 2018, and 2017. During the first quarter of 2019, we early adopted Accounting Standards Update 2017-04, Intangibles-Goodwill and Other (Topic 350): Simplifying the Test for Goodwill Impairment, which removed the requirement to perform the previous two-step goodwill impairment test.
We also test indefinite-lived intangible assets for impairment at least annually during the fourth quarter, generally on December 31. Management may perform an interim indefinite-lived intangible asset impairment assessment whenever events or circumstances make it more likely than not that an impairment may have occurred, such as a significant adverse change in the business climate or a decision to sell or dispose of the reporting unit. If the carrying value of the indefinite-lived asset is higher than its fair value, then the asset is deemed to be impaired and the impairment charge is estimated as the difference. The Company calculates the fair value of its indefinite-lived intangible assets using the income approach, specifically the relief-from-royalty method. The relief-from-royalty method is used to estimate the cost savings that accrue to the owner of an intangible asset who would otherwise have to pay royalties or license fees on revenues earned through the use of the asset. Internally forecasted revenues, which the Company believes reasonably approximate market participant assumptions, are multiplied by a royalty rate to arrive at the estimated net after tax cost savings. The royalty rate used in the analysis is based on an analysis of empirical, market-derived royalty rates for comparable intangible assets. The net after tax cost savings are discounted using the same weighted-average cost of capital discount rate developed for purposes of the Company's quantitative goodwill impairment test. The key uncertainties in these calculations are the assumptions used in determining the revenue associated with each indefinite-lived intangible asset and the royalty rate. If we do not achieve the results reflected in the assumptions and estimates, our indefinite-lived intangibles impairment evaluations could be adversely affected, and we may impair a portion or all of their carrying values, which would adversely affect our operating results in the period of impairment. |
Recent Accounting Pronouncements
See “Recent Accounting Pronouncements” in Note 1 to the notes to consolidated financial statements.
30
Results of Operations (In Thousands)
Consolidated Year Ended December 31, 2019 Compared to Consolidated Year Ended December 31, 2018
The following presents a discussion of consolidated operations for the year ended December 31, 2019, compared with the consolidated year ended December 31, 2018:
| Year Ended December 31, | ||||||||
| 2019 | 2018 | |||||||
| Sales | ||||||||
| Domestic sales | $ | 121,751 | $ | 112,537 | ||||
| International sales | 107,686 | 99,604 | ||||||
| Total sales | 229,437 | 212,141 | ||||||
| Cost of goods sold | 149,146 | 138,179 | ||||||
| Gross profit | 80,291 | 73,962 | ||||||
| Operating expenses | ||||||||
| Selling, general and administrative | 68,680 | 65,151 | ||||||
| Restructuring charge | 13 | 137 | ||||||
| Transaction costs | 166 | 503 | ||||||
| Total operating expenses | 68,859 | 65,791 | ||||||
| Operating income | 11,432 | 8,171 | ||||||
| Other (expense) income | ||||||||
| Interest expense, net | (1,358 | ) | (1,339 | ) | ||||
| Other, net | (93 | ) | (359 | ) | ||||
| Total other expense, net | (1,451 | ) | (1,698 | ) | ||||
| Income before income tax | 9,981 | 6,473 | ||||||
| Income tax benefit | (8,991 | ) | (828 | ) | ||||
| Net income | $ | 18,972 | $ | 7,301 | ||||
Sales
Consolidated sales increased $17,296, or 8.2%, to $229,437 during the year ended December 31, 2019, compared to consolidated sales of $212,141 during the year ended December 31, 2018. The increase in sales was attributable to the increase in the quantity of new and existing climb, mountain, and ski products sold during the period. These increases were partially offset by a decrease in the quantity of new and existing sport products sold during the period and a decrease in sales of $2,603 due to the strengthening of the U.S. dollar against foreign currencies during the year ended December 31, 2019 compared to the prior period.
Consolidated domestic sales increased $9,214, or 8.2%, to $121,751 during the year ended December 31, 2019, compared to consolidated domestic sales of $112,537 during the year ended December 31, 2018. The increase in domestic sales was attributable to an increase in the quantity of new and existing climb, mountain, and ski products sold during the year ended December 31, 2019. These increases were partially offset by a decrease in the quantity of new and existing sport products sold during the period.
Consolidated international sales increased $8,082, or 8.1%, to $107,686 during the year ended December 31, 2019, compared to consolidated international sales of $99,604 during the year ended December 31, 2018. The increase in international sales was attributable to the increase in the quantity of new and existing climb, mountain, and ski products sold during the year ended December 31, 2019. These increases were partially offset by a decrease in the quantity of new and existing sport products sold during the period and a decrease in sales of $2,603 due to the strengthening of the U.S. dollar against foreign currencies during the year ended December 31, 2019 compared to the prior period.
31
Cost of Goods Sold
Consolidated cost of goods sold increased $10,967, or 7.9%, to $149,146 during the year ended December 31, 2019, compared to consolidated cost of goods sold of $138,179 during the year ended December 31, 2018. The increase in cost of goods sold was attributable to an increase in the number of units sold.
Gross Profit
Consolidated gross profit increased $6,329, or 8.6%, to $80,291 during the year ended December 31, 2019, compared to consolidated gross profit of $73,962 during the year ended December 31, 2018. Consolidated gross margin was 35.0% during the year ended December 31, 2019, compared to a consolidated gross margin of 34.9% during the year ended December 31, 2018. Consolidated gross margin during the year ended December 31, 2019, increased compared to the prior year due to a favorable product mix in higher margin products. Gross margin during the year ended December 31, 2018 included a decrease in gross margin of 0.5% due to the sale of inventory that was recorded at its fair value in purchase accounting.
Selling, General and Administrative
Consolidated selling, general, and administrative expenses increased $3,529, or 5.4%, to $68,680 during the year ended December 31, 2019, compared to consolidated selling, general and administrative expenses of $65,151 during the year ended December 31, 2018. The increase in selling, general and administrative expenses was attributable to the Company’s continued investments in the brand related activities of research and development, marketing, direct-to-consumer, and warehousing and logistics, focused on supporting its strategic initiatives around new product introductions, elevating brand awareness, and being easier to do business with. Stock compensation also increased $297 during the year ended December 31, 2019 compared to the prior year.
Restructuring Charges
Consolidated restructuring expense decreased $124, or 90.5%, to $13 during the year ended December 31, 2019, compared to consolidated restructuring expense of $137 during the year ended December 31, 2018. Restructuring expenses incurred during the year ended December 31, 2019 and 2018, related to costs associated with the formal closure and liquidation of the Company’s Black Diamond Equipment manufacturing operations in Zhuhai, China.
Transaction Costs
Consolidated transaction expense decreased to $166 during the year ended December 31, 2019, compared to consolidated transaction costs of $503 during the year ended December 31, 2018, which consisted of expenses related to the Company’s acquisition of Sierra.
Interest Expense, net
Consolidated interest expense, net increased $19, or 1.4%, to $1,358 during the year ended December 31, 2019, compared to consolidated interest expense, net, of $1,339 during the year ended December 31, 2018. Interest expense recognized during the year ended December 31, 2019 was primarily associated with the average outstanding debt amounts during the period. Interest expense recognized during the year ended December 31, 2018 was primarily attributable to the write-off of previously capitalized origination costs and interest expense associated with the average outstanding debt amounts during the period.
Other, net
Consolidated other, net, decreased $266, or 74.1%, to expense of $93 during the year ended December 31, 2019, compared to consolidated other, net expense of $359 during the year ended December 31, 2018. The decrease in other, net, was primarily attributable to a decrease in remeasurement losses recognized on the Company’s foreign denominated accounts receivable and accounts payable and a decrease in gains on mark-to-market adjustments on non-hedged foreign currency contracts. During the year ended December 31, 2018, the expense included losses related to recognition of cumulative translation adjustments due to the substantial liquidation of a foreign entity.
Income Taxes
Consolidated income tax benefit increased $8,163, or 985.9%, to $8,991 during the year ended December 31, 2019, compared to a consolidated income tax benefit of $828 during the same period in 2018. The tax benefit recorded during the year ended December 31, 2019 includes a release of certain valuation allowances of $13,490 and a discrete benefit associated with stock compensation windfall for $368.
Our effective income tax rate was 90.1% for the year ended December 31, 2019, compared to 12.8% for the same period in 2018. The primary reasons for the effective income tax rate changes are due to differing levels of income before income tax, release of a partial valuation allowance of the deferred tax assets, and discrete charges recorded during the respective periods. Factors that could cause our annual effective tax rate to differ materially from our quarterly effective tax rates include changes in the geographic mix of taxable income and discrete events that may occur.
32
Consolidated Year Ended December 31, 2018 Compared to Consolidated Year Ended December 31, 2017
The following presents a discussion of consolidated operations for the year ended December 31, 2018 compared with the consolidated year ended December 31, 2017:
| Year Ended December 31, | ||||||||
| 2018 | 2017 | |||||||
| Sales | ||||||||
| Domestic sales | $ | 112,537 | $ | 88,603 | ||||
| International sales | 99,604 | 82,084 | ||||||
| Total sales | 212,141 | 170,687 | ||||||
| Cost of goods sold | 138,179 | 116,877 | ||||||
| Gross profit | 73,962 | 53,810 | ||||||
| Operating expenses | ||||||||
| Selling, general and administrative | 65,151 | 56,295 | ||||||
| Restructuring charge | 137 | 160 | ||||||
| Merger and integration | - | 82 | ||||||
| Transaction costs | 503 | 2,088 | ||||||
| Total operating expenses | 65,791 | 58,625 | ||||||
| Operating income (loss) | 8,171 | (4,815 | ) | |||||
| Other (expense) income | ||||||||
| Interest expense, net | (1,339 | ) | (1,288 | ) | ||||
| Other, net | (359 | ) | 343 | |||||
| Total other expense, net | (1,698 | ) | (945 | ) | ||||
| Income (loss) before income tax | 6,473 | (5,760 | ) | |||||
| Income tax benefit | (828 | ) | (5,087 | ) | ||||
| Net income (loss) | $ | 7,301 | $ | (673 | ) | |||
Sales
Consolidated sales increased $41,454, or 24.3%, to $212,141 during the year ended December 31, 2018, compared to consolidated sales of $170,687 during the year ended December 31, 2017. The increase in sales was partially attributable to the inclusion of Sierra, which contributed $35,395 in total sales and $25,039 in incremental sales during the year ended December 31, 2018. The remaining increase was attributable to the increase in the quantity of new and existing climb and mountain products sold during the period and an increase in sales of $2,799 due to the strengthening of foreign currencies against the U.S. dollar during the year ended December 31, 2018 compared to the prior period.
Consolidated domestic sales increased $23,934, or 27.0%, to $112,537 during the year ended December 31, 2018, compared to consolidated domestic sales of $88,603 during the year ended December 31, 2017. The increase in sales was attributable to the inclusion of Sierra, which contributed $26,105 in total sales and $18,668 in incremental sales during the year ended December 31, 2018. The remaining increase was attributable to the increase in the quantity of new and existing climb and mountain products sold during the year ended December 31, 2018.
Consolidated international sales increased $17,520, or 21.3%, to $99,604 during the year ended December 31, 2018, compared to consolidated international sales of $82,084 during the year ended December 31, 2017. The increase in sales was partially attributable to the inclusion of Sierra, which contributed $9,290 in total sales and $6,371 in incremental sales during the year ended December 31, 2018. The remaining increase in international sales was attributable to the increase in the quantity of new and existing climb and mountain products sold during the period and an increase in sales of $2,799 due to the strengthening of foreign currencies against the U.S. dollar during the year ended December 31, 2018 compared to the prior period.
33
Cost of Goods Sold
Consolidated cost of goods sold increased $21,302, or 18.2%, to $138,179 during the year ended December 31, 2018, compared to consolidated cost of goods sold of $116,877 during the year ended December 31, 2017. The increase in cost of goods sold was partially attributable to the inclusion of Sierra, which contributed $14,382 in incremental cost of goods sold, which included $1,049 related to the sale of inventory that was recorded at fair value in purchase accounting. The remaining increase was attributable to an increase in the number of units sold and the mix of higher cost products sold.
Gross Profit
Consolidated gross profit increased $20,152 or 37.5%, to $73,962 during the year ended December 31, 2018, compared to consolidated gross profit of $53,810 during the year ended December 31, 2017. Consolidated gross margin was 34.9% during the year ended December 31, 2018, compared to a consolidated gross margin of 31.5% during the year ended December 31, 2017. Consolidated gross margin during the year ended December 31, 2018, increased compared to the prior year due to a favorable product mix in higher margin products and channel distribution. Gross margin also benefited from the inclusion of Sierra; however, this benefit was partially offset by a decrease in gross margin of 0.5% due to the sale of inventory that was recorded at its fair value in purchase accounting. Consolidated gross margin during the year ended December 31, 2017 was also negatively impacted by 1.2% due to the sale of inventory that was recorded at its preliminary fair value in purchase accounting.
Selling, General and Administrative
Consolidated selling, general, and administrative expenses increased $8,856, or 15.7%, to $65,151 during the year ended December 31, 2018, compared to consolidated selling, general and administrative expenses of $56,295 during the year ended December 31, 2017. The increase in selling, general and administrative expenses was partially attributable to the inclusion of Sierra of $4,504 in incremental selling, general, and administrative expenses. The remaining increase being attributable to the Company’s investment in the brand related activities of sales, marketing, research and development, and fulfillment in supporting its strategic initiatives around new product introduction and increasing brand equity. Stock compensation also increased $1,471 during the year ended December 31, 2018 compared to the prior year.
Restructuring Charges
Consolidated restructuring expense decreased $23, or 14.4%, to $137 during the year ended December 31, 2018, compared to consolidated restructuring expense of $160 during the year ended December 31, 2017. Restructuring expenses incurred during the year ended December 31, 2018, related to costs associated with the formal closure and liquidation of the Company’s Black Diamond Equipment manufacturing operations in Zhuhai, China.
Merger and Integration Costs
Consolidated merger and integration expense decreased to $0 during the year ended December 31, 2018 compared to consolidated merger and integration expense of $82 during the year ended December 31, 2017, which consisted of expenses related to the integration of Sierra.
Transaction Costs
Consolidated transaction expense decreased to $503 during the year ended December 31, 2018, compared to consolidated transaction costs of $2,088 during the year ended December 31, 2017, which consisted of expenses related to the Company’s acquisition of Sierra.
Interest Expense, net
Consolidated interest expense, net increased $51, or 4.0%, to $1,339 during the year ended December 31, 2018, compared to consolidated interest expense, net, of $1,288 during the year ended December 31, 2017. Interest expense recognized during the year ended December 31, 2018 was primarily attributable to the write-off of previously capitalized origination costs of $279 associated with our previous credit facility, which was replaced with the new Credit Agreement with JPMorgan Chase Bank, N.A., and interest expense associated with the average outstanding debt amounts during the year ended December 31, 2018. Interest expense recognized during the year ended December 31, 2017 was primarily attributable to the Company’s 5% Senior Subordinated Notes which were repaid during the year ended December 31, 2017.
Other, net
Consolidated other, net, decreased $702, or 204.7%, to expense of $359 during the year ended December 31, 2018, compared to consolidated other, net income of $343 during the year ended December 31, 2017. The decrease in other, net, was primarily attributable to a decrease in remeasurement gains recognized on the Company’s foreign denominated accounts receivable and accounts payable and losses related to recognition of cumulative translation adjustments due to the substantial liquidation of a foreign entity. This decrease was partially offset by gains on mark-to-market adjustments on non-hedged foreign currency contracts.
34
Income Taxes
Consolidated income tax benefit decreased $4,259, or 83.7%, to a benefit of $828 during the year ended December 31, 2018, compared to a consolidated income tax benefit of $5,087 during the same period in 2017. Due to the Tax Cuts and Jobs Act (“Tax Act”) enacted in December 2017, the profit before tax benefit recorded during the year ended December 31, 2018 was expensed at the federal statutory rate of 21% compared to 35% in 2017.
Our effective income tax rate was a benefit of 12.8% for the year ended December 31, 2018, compared to 88.3% for the same period in 2017. The primary reasons for the effective income tax rate changes are due to differing levels of income (loss) before income tax and discrete charges recorded during the respective periods. The tax benefit recorded for the year ended December 31, 2018 included charges associated to the usage of previous net operating losses (“NOL”) as well as charges for discrete items associated with a tax windfall deduction from the vesting of restricted stock units and the exercises of stock options. Factors that could cause our annual effective tax rate to differ materially from our quarterly effective tax rates include changes in the geographic mix of taxable income and discrete events that may occur.
Liquidity and Capital Resources (In Thousands)
Consolidated Year ended December 31, 2019 Compared to Consolidated Year ended December 31, 2018
The following presents a discussion of cash flows for the consolidated year ended December 31, 2019 compared with the consolidated year ended December 31, 2018. Our primary ongoing funding requirements are for working capital, expansion of our operations (both organically and through acquisitions) and general corporate needs, as well as investing activities associated with the expansion into new product categories. We plan to fund these activities through a combination of our future operating cash flows and revolving credit facility. We believe that our liquidity requirements for at least the next 12 months will be adequately covered by cash provided by operations and our existing revolving credit facility. At December 31, 2019, we had total cash of $1,703 compared to a cash balance of $2,486 at December 31, 2018, which was substantially controlled by the Company’s U.S. entities. At December 31, 2019, the Company had $1,318 of the $1,703 in cash held by foreign entities, of which $521 is considered permanently reinvested.
| Year Ended December 31, | ||||||||
| 2019 | 2018 | |||||||
| Net cash provided by operating activities | $ | 9,522 | $ | 11,393 | ||||
| Net cash used in investing activities | (4,096 | ) | (4,079 | ) | ||||
| Net cash used in financing activities | (6,286 | ) | (6,559 | ) | ||||
| Effect of foreign exchange rates on cash | 77 | (125 | ) | |||||
| Change in cash | (783 | ) | 630 | |||||
| Cash, beginning of period | 2,486 | 1,856 | ||||||
| Cash, end of period | $ | 1,703 | $ | 2,486 | ||||
Net Cash From Operating Activities
Consolidated net cash provided by operating activities was $9,522 during the year ended December 31, 2019 compared to consolidated net cash provided by operating activities of $11,393 during the year ended December 31, 2018. The decrease in net cash provided by operating activities during 2019 is primarily due to an increase in net operating assets, net of assets acquired or non-cash working capital of $6,171, and deferred taxes partially offset by an increase in net income during the year ended December 31, 2019, compared to the same period in 2018.
Free cash flow, defined as net cash provided by operating activities less capital expenditures, was free cash flows generated of $5,406 during the year ended December 31, 2019 compared to free cash flows used of $8,028 during the same period in 2018. The Company believes that the non-GAAP measure, free cash flow, provides an understanding of the capital required by the Company to expand its asset base. A reconciliation of free cash flows to comparable GAAP financial measures is set forth below:
35
| Year Ended December 31, | ||||||||
| 2019 | 2018 | |||||||
| Net cash provided by operating activities | $ | 9,522 | $ | 11,393 | ||||
| Purchase of property and equipment | (4,116 | ) | (3,365 | ) | ||||
| Free cash flow | $ | 5,406 | $ | 8,028 | ||||
Net Cash From Investing Activities
Consolidated net cash used in investing activities was $4,096 during the year ended December 31, 2019 compared to consolidated net cash used in investing activities of $4,079 during the year ended December 31, 2018. The increase in cash used during the year ended December 31, 2019 is due to an increase in purchases of property and equipment, compared to the same period in 2018.
Net Cash From Financing Activities
Consolidated net cash used in financing activities was $6,286 during the year ended December 31, 2019, compared to consolidated net cash used in financing activities of $6,559 during the year ended December 31, 2018. The decrease in cash used during the year ended December 31, 2019 compared to the same period in 2018 is primarily due to decreases in the purchase of treasury stock and payments of debt issuance costs and increases in the proceeds from exercise of stock options. This decrease was partially offset by increased cash dividends paid and a decrease in net proceeds from the revolving credit facility.
Net Operating Loss
As of December 31, 2019, the Company had net operating loss and research and experimentation credit for U.S. federal income tax purposes of $131,621 and $4,250, respectively. The Company believes its U.S. Federal NOL will offset some of its future U.S. Federal income taxes. The majority of the Company’s pre-tax income is currently earned and expected to be earned in the U.S., or taxed in the U.S. as Subpart F income and will be offset with the NOL. $131,621 of net operating losses available to offset taxable income does not expire until 2021 or later, subject to compliance with Section 382 of the Internal Revenue Code of 1986, as amended.
As of December 31, 2019, the Company’s gross deferred tax asset was $43,945. The Company has recorded a valuation allowance of $28,632, resulting in a net deferred tax asset of $15,313, before deferred tax liabilities of $8,633. The Company has provided a valuation allowance against a portion of the net deferred tax assets as of December 31, 2019, because the ultimate realization of those assets does not meet the more likely than not criteria. The majority of the Company’s deferred tax assets consist of net operating loss carryforwards for federal tax purposes. If a change in control were to occur, these could be limited under Section 382 of the Internal Revenue Code of 1986 (“Code”), as amended.
Credit Agreement
On May 3, 2019, the Company together with certain of its direct and indirect domestic subsidiaries (the “Borrowers”) and the other loan parties party thereto entered into a Credit Agreement with JPMorgan Chase Bank, N.A., as administrative agent, and the lenders from time to time party thereto, for borrowings of up to $60,000 under a revolving credit facility (including up to $5,000 for letters of credit), and borrowings of up to $40,000 under a term loan facility that is available to be drawn until May 3, 2020. The Credit Agreement also permits the Borrowers, subject to certain requirements, to arrange with lenders for an aggregate of up to $50,000 of additional revolving and/or term loan commitments (both of which are currently uncommitted), for potential aggregate revolving and term loan commitments under the Credit Agreement of up to $150,000. The Credit Agreement matures on May 3, 2024.
The Borrowers may elect to have the revolving and term loans under the Credit Agreement bear interest at an alternate base rate or a Eurodollar rate plus an applicable rate. The applicable rate for these borrowings will range from 0.50% to 1.25% per annum, in the case of alternate base rate borrowings, and 1.50% to 2.25% per annum, in the case of Eurodollar borrowings. The applicable rate was initially 0.875% per annum, in the case of alternate base rate borrowings, and 1.875% per annum, in the case of Eurodollar borrowings, however, it may be adjusted from time to time based upon the level of the Company’s consolidated total leverage ratio. The Credit Agreement also requires the Borrowers to pay a commitment fee on the unused portion of the revolving and term loan commitments. Such commitment fee will range between 0.15% and 0.25% per annum, and is also based upon the level of the Company’s consolidated total leverage ratio.
All obligations under the Credit Agreement are secured by 100% of our domestic, and 65% of our foreign, subsidiary equity interests, as well as accounts receivable, inventory, intellectual property and certain other assets owned by the Company. The Credit Agreement contains restrictions on the Company’s ability to pay dividends or make distributions or other restricted payments if certain conditions in the Credit Agreement are not fulfilled. The Credit Agreement includes customary affirmative and negative covenants, including financial covenants relating to the Company’s consolidated total leverage ratio and fixed charge coverage ratio. The Company was in compliance with the debt covenants set forth in the Credit Agreement as of December 31, 2019.
36
As of December 31, 2019, the Company had drawn approximately $22,670 of the $60,000 revolving loan commitment, and none of the $40,000 term loan commitment, that was available for borrowing under the Credit Agreement. As of December 31, 2019, the interest rate for such loans was 3.3125%.
On May 3, 2019, concurrent with entering into the Credit Agreement, the Company’s previous credit facility with JPMorgan Chase Bank, N.A., which provided for a revolving commitment of up to $75,000, was paid in full and terminated.
5% Senior Subordinated Notes due May 28, 2017
As part of the consideration payable to the stockholders of a formerly acquired entity, the Company issued 5% Unsecured Subordinated Notes due May 28, 2017 (the “Merger Consideration Subordinated Notes”) to members of the Board of Directors and five former employees. Given the below market interest rate for comparably secured notes and the relative illiquidity of the Merger Consideration Subordinated Notes, we discounted the notes at the date of acquisition. We were accreting the discount on the Merger Consideration Subordinated Notes to interest expense using the effective interest method over the term of the Merger Consideration Subordinated Notes. In February 2017, the Board of Directors approved the repayment of the Merger Consideration Subordinated Notes. On February 13, 2017, the entire principal amounts and all accrued interest amounts were paid in full, at which time, the note discount of $814 was expensed and recognized as interest expense during the three months ended March 31, 2017.
Off-Balance Sheet Arrangements
We do not engage in any transactions or have relationships or other arrangements with unconsolidated entities. These include special purpose and similar entities or other off-balance sheet arrangements. We also do not engage in energy, weather or other commodity-based contracts.
Contractual Obligations
The following summarizes our contractual obligations and commercial commitments at December 31, 2019 with initial or remaining terms of one or more years, and the effect such obligations are expected to have on our liquidity and cash flow in future periods:
| Payments due by period | ||||||||||||||||||||
| Total | Less than 1 year | 1-3 years | 3-5 years | More than 5 years | ||||||||||||||||
| (in thousands) | ||||||||||||||||||||
| Contractual Obligations: | ||||||||||||||||||||
| Recorded liabilities: | ||||||||||||||||||||
| Revolving credit facility (1) | $ | 22,670 | $ | - | $ | - | $ | 22,670 | $ | - | ||||||||||
| Operating leases (2) | 1,230 | 732 | 432 | 56 | 10 | |||||||||||||||
| Other long-term liabilities (3) | 110 | - | 29 | - | 81 | |||||||||||||||
| Unrecorded commitments: | ||||||||||||||||||||
| Interest payment obligations (4) | 3,257 | 751 | 1,502 | 1,004 | - | |||||||||||||||
| Purchase obligations (5) | 22,255 | 22,255 | - | - | - | |||||||||||||||
| $ | 49,522 | $ | 23,738 | $ | 1,963 | $ | 23,730 | $ | 91 | |||||||||||
| (1) | Revolving credit facility represents required principal payments under the Credit Agreement. |
| (2) | Operating leases represent required minimum lease payments. |
| (3) | Other long-term liabilities represent payments due for other noncurrent liabilities in the Company’s consolidated balance sheet. |
| (4) | Interest payment obligations represent required interest payments on the revolving credit facility. Amounts exclude bank fees that would be included in interest expense in the consolidated financial statements. |
| (5) | Purchase obligations represent an agreement to purchase goods or services. |
The Company has uncertain tax positions of $561 as of December 31, 2019, however the specific timing of the settlement is uncertain and has been excluded from the table above.
37
ITEM 7A. QUANTITATIVE AND QUALITATIVE DISCLOSURES ABOUT MARKET RISK
In general, we can be exposed to market risks including fluctuations in interest rates, foreign currency exchange rates and certain commodity prices, and that can affect the cost of operating, investing, and financing under those conditions. The Company believes it has moderate exposure to these risks. We assess market risk based on changes in interest rates, foreign currency rates, and commodity prices utilizing a sensitivity analysis that measures the potential loss in earnings, fair values, and cash flows based on a hypothetical change in these rates and prices.
Interest Rate Risks
Our primary exposure to market risk is interest rate risk associated with our credit facility, since the interest is indexed to LIBOR. We entered into our current credit facility on May 3, 2019, and simultaneously terminated our previous credit facility. The applicable interest rate for the outstanding borrowings under our applicable credit facility as of December 31, 2019 and 2018 was 3.3125% and 3.8493%, respectively. Amounts outstanding as of December 31, 2019 and 2018 were $22,670,000 and $22,062,000, respectively. An increase of 100-basis points in market interest rates would not cause a material effect on interest expense.
Foreign Currency Risks
While we transact business predominantly in U.S. dollars and most of our revenues are collected in U.S. dollars, a portion of our revenues and operating costs are denominated in other currencies. Given the current political uncertainty surrounding the European Union and other economic uncertainties worldwide, changes in the relation of these and other currencies to the U.S. dollar will affect our sales and profitability and could result in exchange losses. For the year ending December 31, 2019, approximately 31% of our sales were denominated in foreign currencies (compared to 33% in the prior year), the most significant of which were the Euro, Canadian Dollar, Norwegian Kroner, and Swiss Franc. The primary purpose of our foreign currency hedging activities is to mitigate the foreign currency exchange rate exposure on the cash flows related to forecasted inventory purchases and sales. A hypothetical 10% change in foreign currency rates would not have a material effect on foreign currency gains and losses related to the foreign currency derivatives or the net fair value of the Company’s foreign currency derivatives. We have not held a material amount of foreign assets during the years ended December 31, 2019, 2018 and 2017, and do not believe our foreign assets expose us to a material foreign currency risk.
Derivative Instruments
We employ a variety of practices to manage these market risks, including operating and financing activities and, where deemed appropriate, the use of derivative instruments. Derivative instruments are used only for risk management purposes and not for speculation or trading. Derivatives are such that a specific debt instrument, contract, or anticipated purchase determines the amount, maturity, and other specifics of the hedge. If a derivative contract is entered into, we either determine that it is an economic hedge or we designate the derivative as a cash flow or fair value hedge. We do not hold derivative financial investments, derivative commodity investments, engage in foreign currency hedging or other transactions that expose us to material market risks.
38
ITEM 8. FINANCIAL STATEMENTS AND SUPPLEMENTARY DATA
CLARUS CORPORATION AND SUBSIDIARIES
Index to Financial Statements
39
REPORT OF INDEPENDENT REGISTERED PUBLIC ACCOUNTING FIRM
To the Stockholders and the Board of Directors of Clarus Corporation:
Opinion on the Financial Statements
We have audited the accompanying consolidated balance sheets of Clarus Corporation and subsidiaries (the "Company") as of December 31, 2019 and 2018, the related consolidated statements of comprehensive income, stockholders' equity, and cash flows, for each of the two years in the period ended December 31, 2019, and the related notes (collectively referred to as the "financial statements"). In our opinion, the financial statements present fairly, in all material respects, the financial position of the Company as of December 31, 2019 and 2018, and the results of its operations and its cash flows for each of the two years in the period ended December 31, 2019, in conformity with accounting principles generally accepted in the United States of America.
We have also audited, in accordance with the standards of the Public Company Accounting Oversight Board (United States) (PCAOB), the Company's internal control over financial reporting as of December 31, 2019, based on criteria established in Internal Control — Integrated Framework (2013) issued by the Committee of Sponsoring Organizations of the Treadway Commission and our report dated March 9, 2020, expressed an unqualified opinion on the Company's internal control over financial reporting.
Basis for Opinion
These financial statements are the responsibility of the Company's management. Our responsibility is to express an opinion on the Company's financial statements based on our audits. We are a public accounting firm registered with the PCAOB and are required to be independent with respect to the Company in accordance with the U.S. federal securities laws and the applicable rules and regulations of the Securities and Exchange Commission and the PCAOB.
We conducted our audits in accordance with the standards of the PCAOB. Those standards require that we plan and perform the audit to obtain reasonable assurance about whether the financial statements are free of material misstatement, whether due to error or fraud. Our audits included performing procedures to assess the risks of material misstatement of the financial statements, whether due to error or fraud, and performing procedures that respond to those risks. Such procedures included examining, on a test basis, evidence regarding the amounts and disclosures in the financial statements. Our audits also included evaluating the accounting principles used and significant estimates made by management, as well as evaluating the overall presentation of the financial statements. We believe that our audits provide a reasonable basis for our opinion.
/s/ Deloitte & Touche LLP
Salt Lake City, Utah
March 9, 2020
We have served as the Company's auditor since 2018.
40
REPORT OF INDEPENDENT REGISTERED PUBLIC ACCOUNTING FIRM
To the Stockholders and Board of Directors of Clarus Corporation:
Opinion on the Consolidated Financial Statements
We have audited the accompanying consolidated statements of comprehensive income, stockholders’ equity, and cash flows of Clarus Corporation and subsidiaries (the Company) for the year ended December 31, 2017, and the related notes (collectively, the consolidated financial statements). In our opinion, the consolidated financial statements present fairly, in all material respects, the results of operations of the Company and its cash flows for the year ended December 31, 2017, in conformity with U.S. generally accepted accounting principles.
Basis for Opinion
These consolidated financial statements are the responsibility of the Company’s management. Our responsibility is to express an opinion on these consolidated financial statements based on our audit. We are a public accounting firm registered with the Public Company Accounting Oversight Board (United States) (PCAOB) and are required to be independent with respect to the Company in accordance with the U.S. federal securities laws and the applicable rules and regulations of the Securities and Exchange Commission and the PCAOB.
We conducted our audit in accordance with the standards of the PCAOB. Those standards require that we plan and perform the audit to obtain reasonable assurance about whether the consolidated financial statements are free of material misstatement, whether due to error or fraud. Our audit included performing procedures to assess the risks of material misstatement of the consolidated financial statements, whether due to error or fraud, and performing procedures that respond to those risks. Such procedures included examining, on a test basis, evidence regarding the amounts and disclosures in the consolidated financial statements. Our audit also included evaluating the accounting principles used and significant estimates made by management, as well as evaluating the overall presentation of the consolidated financial statements. We believe that our audit provides a reasonable basis for our opinion.
/s/ KPMG LLP
We served as the Company’s auditor from 2000 to 2018.
Salt Lake City, Utah
March 12, 2018
41
CONSOLIDATED BALANCE SHEETS
(In thousands, except per share amounts)
| December 31, | ||||||||
| 2019 | 2018 | |||||||
| Assets | ||||||||
| Current assets | ||||||||
| Cash | $ | 1,703 | $ | 2,486 | ||||
| Accounts receivable, net | 41,628 | 35,943 | ||||||
| Inventories | 73,432 | 64,933 | ||||||
| Prepaid and other current assets | 3,787 | 5,115 | ||||||
| Income tax receivable | 322 | 24 | ||||||
| Total current assets | 120,872 | 108,501 | ||||||
| Property and equipment, net | 22,919 | 23,401 | ||||||
| Other intangible assets, net | 15,816 | 19,416 | ||||||
| Indefinite lived intangible assets | 41,630 | 41,694 | ||||||
| Goodwill | 18,090 | 18,090 | ||||||
| Deferred income taxes | 7,904 | - | ||||||
| Other long-term assets | 3,034 | 2,026 | ||||||
| Total assets | $ | 230,265 | $ | 213,128 | ||||
| Liabilities and Stockholders' Equity | ||||||||
| Current liabilities | ||||||||
| Accounts payable and accrued liabilities | $ | 24,304 | $ | 21,489 | ||||
| Income tax payable | 260 | 210 | ||||||
| Current portion of long-term debt | - | 41 | ||||||
| Total current liabilities | 24,564 | 21,740 | ||||||
| Long-term debt | 22,670 | 22,105 | ||||||
| Deferred income taxes | 1,224 | 2,919 | ||||||
| Other long-term liabilities | 615 | 159 | ||||||
| Total liabilities | 49,073 | 46,923 | ||||||
| Stockholders' Equity | ||||||||
| Preferred stock, $.0001 par value; 5,000 shares authorized; none issued | - | - | ||||||
| Common stock, $.0001 par value; 100,000 shares authorized; 33,615 and 33,244 issued and 29,760 and 29,748 outstanding, respectively | 3 | 3 | ||||||
| Additional paid in capital | 492,353 | 488,404 | ||||||
| Accumulated deficit | (288,592 | ) | (304,577 | ) | ||||
| Treasury stock, at cost | (22,269 | ) | (18,102 | ) | ||||
| Accumulated other comprehensive (loss) income | (303 | ) | 477 | |||||
| Total stockholders' equity | 181,192 | 166,205 | ||||||
| Total liabilities and stockholders' equity | $ | 230,265 | $ | 213,128 | ||||
See accompanying notes to consolidated financial statements.
42
CONSOLIDATED STATEMENTS OF COMPREHENSIVE INCOME
(In thousands, except per share amounts)
| Year Ended December 31, | ||||||||||||
| 2019 | 2018 | 2017 | ||||||||||
| Sales | ||||||||||||
| Domestic sales | $ | 121,751 | $ | 112,537 | $ | 88,603 | ||||||
| International sales | 107,686 | 99,604 | 82,084 | |||||||||
| Total sales | 229,437 | 212,141 | 170,687 | |||||||||
| Cost of goods sold | 149,146 | 138,179 | 116,877 | |||||||||
| Gross profit | 80,291 | 73,962 | 53,810 | |||||||||
| Operating expenses | ||||||||||||
| Selling, general and administrative | 68,680 | 65,151 | 56,295 | |||||||||
| Restructuring charge | 13 | 137 | 160 | |||||||||
| Merger and integration | - | - | 82 | |||||||||
| Transaction costs | 166 | 503 | 2,088 | |||||||||
| Total operating expenses | 68,859 | 65,791 | 58,625 | |||||||||
| Operating income (loss) | 11,432 | 8,171 | (4,815 | ) | ||||||||
| Other (expense) income | ||||||||||||
| Interest expense, net | (1,358 | ) | (1,339 | ) | (1,288 | ) | ||||||
| Other, net | (93 | ) | (359 | ) | 343 | |||||||
| Total other expense, net | (1,451 | ) | (1,698 | ) | (945 | ) | ||||||
| Income (loss) before income tax | 9,981 | 6,473 | (5,760 | ) | ||||||||
| Income tax benefit | (8,991 | ) | (828 | ) | (5,087 | ) | ||||||
| Net income (loss) | 18,972 | 7,301 | (673 | ) | ||||||||
| Other comprehensive (loss) income, net of tax: | ||||||||||||
| Foreign currency translation adjustment | (359 | ) | (832 | ) | 2,634 | |||||||
| Unrealized (loss) income on hedging activities | (421 | ) | 810 | (1,130 | ) | |||||||
| Other comprehensive (loss) income | (780 | ) | (22 | ) | 1,504 | |||||||
| Comprehensive income | $ | 18,192 | $ | 7,279 | $ | 831 | ||||||
| Net income (loss) per share: | ||||||||||||
| Basic | $ | 0.64 | $ | 0.24 | $ | (0.02 | ) | |||||
| Diluted | 0.61 | 0.24 | (0.02 | ) | ||||||||
| Weighted average shares outstanding: | ||||||||||||
| Basic | 29,820 | 29,915 | 30,022 | |||||||||
| Diluted | 30,993 | 30,255 | 30,022 | |||||||||
See accompanying notes to consolidated financial statements.
43
CONSOLIDATED STATEMENTS OF CASH FLOWS
(In thousands)
| Year Ended December 31, | ||||||||||||
| 2019 | 2018 | 2017 | ||||||||||
| Cash Flows From Operating Activities: | ||||||||||||
| Net income (loss) | $ | 18,972 | $ | 7,301 | $ | (673 | ) | |||||
| Adjustments to reconcile net income (loss) to net cash provided by (used in) operating activities: | ||||||||||||
| Depreciation of property and equipment | 4,550 | 4,423 | 2,883 | |||||||||
| Amortization of intangible assets | 3,552 | 3,873 | 2,376 | |||||||||
| Accretion of notes payable | - | - | 833 | |||||||||
| Amortization of debt issuance costs | 283 | 436 | 28 | |||||||||
| Loss on disposition of property and equipment | 62 | 15 | 109 | |||||||||
| Noncash lease expense | 728 | - | - | |||||||||
| Loss (gain) from removal of accumulated translation adjustment | - | 199 | (202 | ) | ||||||||
| Stock-based compensation | 2,949 | 2,652 | 1,181 | |||||||||
| Deferred income taxes | (8,995 | ) | (1,098 | ) | (5,476 | ) | ||||||
| Other | - | - | (523 | ) | ||||||||
| Changes in operating assets and liabilities, net of acquisition: | ||||||||||||
| Accounts receivable | (6,163 | ) | (766 | ) | (8,673 | ) | ||||||
| Inventories | (9,145 | ) | (7,203 | ) | 1,360 | |||||||
| Prepaid and other assets | 856 | (827 | ) | (1,427 | ) | |||||||
| Accounts payable and accrued liabilities | 2,130 | 2,524 | (137 | ) | ||||||||
| Income taxes | (257 | ) | (136 | ) | (579 | ) | ||||||
| Net cash provided by (used in) operating activities | 9,522 | 11,393 | (8,920 | ) | ||||||||
| Cash Flows From Investing Activities: | ||||||||||||
| Purchase of business, net of cash received | - | (720 | ) | (79,238 | ) | |||||||
| Proceeds from disposition of property and equipment | 20 | 6 | 53 | |||||||||
| Purchase of property and equipment | (4,116 | ) | (3,365 | ) | (2,847 | ) | ||||||
| Net cash used in investing activities | (4,096 | ) | (4,079 | ) | (82,032 | ) | ||||||
| Cash Flows From Financing Activities: | ||||||||||||
| Proceeds from revolving credit facilities | 132,215 | 153,556 | 55,778 | |||||||||
| Repayments on revolving credit facilities | (131,607 | ) | (152,336 | ) | (34,936 | ) | ||||||
| Repayments of financing and capital leases | (31 | ) | (39 | ) | (22,727 | ) | ||||||
| Payment of debt issuance costs | (709 | ) | (1,032 | ) | (334 | ) | ||||||
| Purchase of treasury stock | (4,167 | ) | (5,687 | ) | (17 | ) | ||||||
| Proceeds from exercise of stock options | 1,000 | 467 | 179 | |||||||||
| Cash dividends paid | (2,987 | ) | (1,488 | ) | - | |||||||
| Net cash used in financing activities | (6,286 | ) | (6,559 | ) | (2,057 | ) | ||||||
| Effect of foreign exchange rates on cash | 77 | (125 | ) | 127 | ||||||||
| Change in cash | (783 | ) | 630 | (92,882 | ) | |||||||
| Cash, beginning of period | 2,486 | 1,856 | 94,738 | |||||||||
| Cash, end of period | $ | 1,703 | $ | 2,486 | $ | 1,856 | ||||||
| Supplemental Disclosure of Cash Flow Information: | ||||||||||||
| Cash paid for income taxes | $ | 209 | $ | 418 | $ | 931 | ||||||
| Cash paid for interest | $ | 1,086 | $ | 950 | $ | 598 | ||||||
| Supplemental Disclosures of Non-Cash Investing and Financing Activities: | ||||||||||||
| Property and equipment purchased with accounts payable | $ | 408 | $ | 219 | $ | 140 | ||||||
| Property and equipment acquired through a capital lease | $ | - | $ | 123 | $ | - | ||||||
| Lease liabilities arising from obtaining right of use assets | $ | 1,889 | $ | - | $ | - | ||||||
See accompanying notes to consolidated financial statements.
44
CONSOLIDATED STATEMENTS OF STOCKHOLDERS' EQUITY
(In thousands)
| Accumulated | ||||||||||||||||||||||||||||||||
| Additional | Other | Total | ||||||||||||||||||||||||||||||
| Common Stock | Paid-In | Accumulated | Treasury Stock | Comprehensive | Stockholders' | |||||||||||||||||||||||||||
| Shares | Amount | Capital | Deficit | Shares | Amount | Income (Loss) | Equity | |||||||||||||||||||||||||
| Balance, December 31, 2016 | 32,888 | $ | 3 | $ | 483,925 | $ | (309,717 | ) | (2,872 | ) | $ | (12,398 | ) | $ | (1,005 | ) | $ | 160,808 | ||||||||||||||
| Net loss | - | - | - | (673 | ) | - | - | - | (673 | ) | ||||||||||||||||||||||
| Other comprehensive income | - | - | - | - | - | - | 1,504 | 1,504 | ||||||||||||||||||||||||
| Purchase of treasury stock | - | - | - | - | (3 | ) | (17 | ) | - | (17 | ) | |||||||||||||||||||||
| Stock compensation plans, net | 29 | - | 1,360 | - | - | - | - | 1,360 | ||||||||||||||||||||||||
| Balance, December 31, 2017 | 32,917 | 3 | 485,285 | (310,390 | ) | (2,875 | ) | (12,415 | ) | 499 | 162,982 | |||||||||||||||||||||
| Net income | - | - | - | 7,301 | - | - | - | 7,301 | ||||||||||||||||||||||||
| Other comprehensive loss | - | - | - | - | - | - | (22 | ) | (22 | ) | ||||||||||||||||||||||
| Cash dividends ($0.05 per share) | - | - | - | (1,488 | ) | - | - | - | (1,488 | ) | ||||||||||||||||||||||
| Purchase of treasury stock | - | - | - | - | (621 | ) | (5,687 | ) | - | (5,687 | ) | |||||||||||||||||||||
| Stock compensation expense | - | - | 2,652 | - | - | - | - | 2,652 | ||||||||||||||||||||||||
| Proceeds from exercise of options | 327 | - | 467 | - | - | - | - | 467 | ||||||||||||||||||||||||
| Balance, December 31, 2018 | 33,244 | 3 | 488,404 | (304,577 | ) | (3,496 | ) | (18,102 | ) | 477 | 166,205 | |||||||||||||||||||||
| Net income | - | - | - | 18,972 | - | - | - | 18,972 | ||||||||||||||||||||||||
| Other comprehensive loss | - | - | - | - | - | - | (780 | ) | (780 | ) | ||||||||||||||||||||||
| Cash dividends ($0.10 per share) | - | - | - | (2,987 | ) | - | - | - | (2,987 | ) | ||||||||||||||||||||||
| Purchase of treasury stock | - | - | - | - | (359 | ) | (4,167 | ) | - | (4,167 | ) | |||||||||||||||||||||
| Stock compensation expense | - | - | 2,949 | - | - | - | - | 2,949 | ||||||||||||||||||||||||
| Proceeds from exercise of options | 371 | - | 1,000 | - | - | - | - | 1,000 | ||||||||||||||||||||||||
| Balance, December 31, 2019 | 33,615 | $ | 3 | $ | 492,353 | $ | (288,592 | ) | (3,855 | ) | $ | (22,269 | ) | $ | (303 | ) | $ | 181,192 | ||||||||||||||
See accompanying notes to consolidated financial statements.
45
NOTES TO CONSOLIDATED FINANCIAL STATEMENTS
(in thousands, except per share amounts)
NOTE 1. NATURE OF OPERATIONS AND SUMMARY OF SIGNIFICANT ACCOUNTING POLICIES
The accompanying audited consolidated financial statements of Clarus Corporation and subsidiaries (which may be referred to as the “Company,” “Clarus,” “we,” “our” or “us”) have been prepared in accordance with accounting principles generally accepted in the United States of America (“U.S. GAAP”).
Nature of Business
Headquartered in Salt Lake City, Utah, Clarus, a company focused on the outdoor and consumer industries, is seeking opportunities to acquire and grow businesses that can generate attractive shareholder returns. The Company has net operating tax loss carryforwards which it is seeking to redeploy to maximize shareholder value. Clarus’ primary business is as a leading designer, developer, manufacturer and distributor of outdoor equipment and lifestyle products focused on the climb, ski, mountain, sport and skincare markets. The Company’s products are principally sold under the Black Diamond®, Sierra®, PIEPS® and SKINourishment® brand names through outdoor specialty and online retailers, distributors and original equipment manufacturers throughout the U.S. and internationally.
Through our Black Diamond, PIEPS, and SKINourishment brands, we offer a broad range of products including: high-performance, activity-based apparel (such as shells, insulation, midlayers, pants and logowear); rock-climbing footwear and equipment (such as carabiners, protection devices, harnesses, belay devices, helmets, and ice-climbing gear); technical backpacks and high-end day packs; trekking poles; headlamps and lanterns; gloves and mittens; and skincare and other sport-enhancing products. We also offer advanced skis, ski poles, ski skins, and snow safety products, including avalanche airbag systems, avalanche transceivers, shovels, and probes. Through our Sierra brand, we manufacture a wide range of high-performance bullets and ammunition for both rifles and pistols that are used for precision target shooting, hunting and military and law enforcement purposes.
Clarus Corporation, incorporated in Delaware in 1991, acquired Black Diamond Equipment, Ltd. (“Black Diamond Equipment”) in May 2010 and changed its name to Black Diamond, Inc. in January 2011. In October 2012, we acquired PIEPS Holding GmbH and its subsidiaries (collectively, “PIEPS”).
On August 14, 2017, the Company changed its name from Black Diamond, Inc. to Clarus Corporation and its stock ticker symbol from “BDE” to “CLAR” on the NASDAQ stock exchange. On August 21, 2017, the Company acquired Sierra Bullets, L.L.C. (“Sierra”). On November 6, 2018, the Company acquired the assets of SKINourishment, Inc. (“SKINourishment”).
On May 7, 2018, the Company announced a “modified Dutch auction” tender offer for Clarus’ common stock, as well as the preferred share purchase rights associated with such shares (collectively, the “Shares”). On July 11, 2018, the tender offer expired, following which the Company announced it would accept 417,237 Shares for purchase at a price of $8.00 per Share, for an aggregate cost of approximately $3,338, excluding fees and expenses. The Company purchased shares of the Company’s common stock for $4,167 and $2,349 under the Company’s authorized stock repurchase program during the years ended December 31, 2019 and 2018, respectively.
On August 6, 2018, the Company announced that its Board of Directors approved the initiation of a quarterly cash dividend program of $0.025 per share of the Company’s common stock (the “Quarterly Cash Dividend”) or $0.10 per share on an annualized basis. In 2019 and 2018, our total Quarterly Cash Dividends were $2,987 and $1,488, respectively. On January 24, 2020, the Company announced that its Board of Directors approved the payment on February 14, 2020 of the Quarterly Cash Dividend of $0.025 to the record holders of shares of the Company’s common stock as of the close of business on February 3, 2020.
Use of Estimates
The preparation of financial statements in conformity with U.S. GAAP requires management to make estimates and assumptions that affect the reported amounts of assets and liabilities and disclosure of contingent liabilities at the date of the financial statements and the reported amounts of revenue and expenses during the reporting period. The more significant estimates relate to purchase price allocation, excess or obsolete inventory, and valuation of deferred tax assets. We base our estimates on historical experience and other assumptions that are believed to be reasonable under the circumstances. Actual results could differ from these estimates.
Significant Accounting Policies
Principles of Consolidation
The consolidated financial statements include the accounts of Clarus Corporation and its wholly owned subsidiaries. All intercompany balances and transactions have been eliminated in consolidation.
46
CLARUS CORPORATION
NOTES TO CONSOLIDATED FINANCIAL STATEMENTS - CONTINUED
(in thousands, except per share amounts)
Foreign Currency Transactions and Translation
The accounts of the Company’s international subsidiaries’ financial statements which have functional currencies other than the U.S. dollar are translated into U.S. dollars using the exchange rate at the balance sheet dates for assets and liabilities and average exchange rates for the periods for revenues, expenses, gains and losses. Foreign currency translation adjustments are recorded as a separate component of accumulated other comprehensive (loss) income. Foreign currency transaction gains and losses are included in other (expense) income in the consolidated statements of comprehensive income.
Cash Equivalents
The Company considers all highly liquid investments purchased with an original maturity of three months or less to be cash equivalents. At December 31, 2019 and 2018, the Company did not hold any amounts that were considered to be cash equivalents.
Accounts Receivable and Allowance for Doubtful Accounts
The Company records its trade receivables at sales value and establishes a non-specific allowance for estimated doubtful accounts based on historical experience of collectability. In addition, specific allowances are established for customer accounts as known collection problems occur due to insolvency, disputes or other collection issues. The amounts of these specific allowances are estimated by management based on the customer’s financial position, the age of the customer’s receivables and the reasons for any disputes. The allowance for doubtful accounts is reduced by subsequent collections of the specific allowances or by any write-off of customer accounts that are deemed uncollectible. The allowance for doubtful accounts was $494 and $392 at December 31, 2019 and 2018, respectively. There were no significant write-offs of the Company’s accounts receivable during the years ended December 31, 2019, 2018, and 2017.
Inventories
Inventories are stated at the lower of cost (using the first-in, first-out method “FIFO”) or net realizable value. Elements of cost in the Company’s manufactured inventories generally include raw materials, direct labor, manufacturing overhead and freight in. The Company reviews its inventories for excess, close-out, or slow-moving items and makes provisions as necessary to properly reflect inventory values.
Property and Equipment
Property and equipment is stated at historical cost, less accumulated depreciation. Depreciation is computed using the straight-line method over the estimated useful lives. The principal estimated useful lives are: buildings, 30 years; building improvements, 20 years; computer hardware and software and machinery and equipment, 3-10 years; furniture and fixtures, 5 years. Leasehold improvements are amortized over the lesser of the estimated useful life of the improvement or the life of the lease. Equipment under finance leases are stated at the present value of minimum lease payments. Major replacements, which extend the useful lives of equipment, are capitalized and depreciated over the remaining useful life. Normal maintenance and repair items are expensed as incurred. Property and equipment are reviewed for impairment whenever events or changes in circumstances exist that indicate the carrying amount of an asset may not be recoverable. Long-lived assets located outside of the United States are not considered material.
Lease Accounting (Right-of-Use Assets)
Lease assets and lease liabilities are recognized at the commencement of an arrangement where it is determined at inception that a lease exists. Lease assets represent the right to use an underlying asset for the lease term, and lease liabilities represent the obligation to make lease payments arising from the lease. These assets and liabilities are initially recognized based on the present value of lease payments over the lease term calculated using our incremental borrowing rate. Lease terms include options to extend or terminate the lease when it is reasonably certain that those options will be exercised.
Variable lease payments are generally expensed as incurred and include certain non-lease components, such as common area maintenance and other services provided by the lessor, and other charges such as utilities, insurance and property taxes included in the lease. Leases with an initial term of 12 months or less are not recorded on the balance sheet, and the expense for these short-term leases and for operating leases is recognized on a straight-line basis over the lease term. Non-lease components are excluded from the right-of-use (“ROU”) asset and lease liability present value computations. The Company’s lease agreements do not contain any material residual value guarantees or material restrictive covenants.
47
CLARUS CORPORATION
NOTES TO CONSOLIDATED FINANCIAL STATEMENTS - CONTINUED
(in thousands, except per share amounts)
Goodwill
Goodwill represents the excess of the purchase price over the fair market value of identifiable net assets of acquired companies. Goodwill is not amortized, but rather is tested at the reporting unit level at least annually for impairment or more frequently if triggering events or changes in circumstances indicate impairment. Initially, qualitative factors are considered to determine whether it is more likely than not that the fair value of a reporting unit is less than its carrying amount. Some of these qualitative factors may include macroeconomic conditions, industry and market considerations, a change in financial performance, entity-specific events, a sustained decrease in share price, and consideration of the difference between the fair value and carrying amount of a reporting unit as determined in the most recent quantitative assessment. If, through this qualitative assessment, the conclusion is made that it is more likely than not that a reporting unit's fair value is less than its carrying amount, a quantitative impairment analysis is performed. The quantitative impairment analysis involves estimating the fair value of the reporting unit based upon an acceptable valuation method under Accounting Standards Codification (“ASC”) 820, Fair Value Measurement. If the fair value of the reporting unit is less than its carrying amount, an impairment loss is recognized for the excess carrying amount over the fair value computation. Based on the results of the Company’s annual impairment tests completed during the fourth quarter, the Company determined that goodwill was not impaired. No impairment was recorded during the years ended December 31, 2019, 2018, and 2017.
Intangible Assets
Intangible assets represent other intangible assets and indefinite-lived intangible assets acquired. The Company’s other intangible assets, such as certain customer lists and relationships, product technologies, tradenames, trademarks and core technologies are amortized over their estimated useful lives. Other intangible assets are reviewed for impairment whenever events or changes in circumstances exist that indicate the carrying amount of an asset may not be recoverable.
The Company’s indefinite lived intangible assets consists of certain tradenames and trademarks that provide Black Diamond Equipment, PIEPS and Sierra with the exclusive and perpetual rights to manufacture and sell their respective products. Indefinite-lived intangible assets are not amortized; however, they are tested at least annually for impairment or more frequently if events or changes in circumstances exist that may indicate impairment. Initially, qualitative factors are considered to determine whether it is more likely than not that the fair value of an indefinite-lived intangible asset is less than its carrying amount. If, through this qualitative assessment, the conclusion is made that it is more likely than not that an indefinite-lived intangible asset's fair value is less than its carrying amount, or the Company elects to bypass the qualitative assessment, a quantitative impairment analysis is performed by comparing the indefinite-lived intangible asset's book value to its estimated fair value. The fair value for indefinite-lived intangible assets is determined through an income approach using the relief-from-royalty method. The amount of any impairment is measured as the difference between the carrying amount and the fair value of the impaired asset. Based on the results of the Company’s annual impairment tests during the years ended December 31, 2019, 2018, and 2017, no impairment of indefinite-lived intangible assets was recorded.
Accounts Payable and Accrued Liabilities
Accounts payable and accrued liabilities include, but are not limited to, vendor trade payables, accrued payrolls, accrued interest, derivative instruments and other estimated expenses. Accrued liabilities as of December 31, 2019 and 2018 were $9,559 and $7,446, respectively.
Derivative Financial Instruments
The Company uses derivative instruments to hedge currency rate movements on foreign currency denominated sales. The Company enters into forward contracts, option contracts and non-deliverable forwards to manage the impact of foreign currency fluctuations on a portion of its forecasted foreign currency exposure. These derivatives are carried at fair value on the Company’s consolidated balance sheets in prepaid and other current assets, other long-term assets, accounts payable and accrued liabilities, and other long-term liabilities. Changes in fair value of the derivatives not designated as hedge instruments are included in the determination of net income. For derivative contracts designated as hedge instruments, the effective portion of gains and losses resulting from changes in fair value of the instruments are included in accumulated other comprehensive (loss) income and reclassified to sales in the period the underlying hedged item is recognized in earnings.
For all hedging relationships, the Company formally documents the hedging relationship and its risk-management objective and strategy for undertaking the hedge, the hedging instrument, the hedged transaction, the nature of the risk being hedged, how the hedging instrument’s effectiveness in offsetting the hedged risk will be assessed prospectively and retrospectively, and a description of the method used to measure ineffectiveness. The Company also formally assesses, both at the inception of the hedging relationship and on an ongoing basis, whether the derivatives that are used in hedging relationships are highly effective in offsetting changes in cash flows of hedged transactions. The Company uses operating budgets and cash flow forecasts to estimate future foreign currency cash flow exposures and to determine the level and timing of derivative transactions intended to mitigate such exposures in accordance with its risk management policies. The Company discontinues hedge accounting prospectively when it determines that the derivative is no longer effective in offsetting cash flows attributable to the hedged risk, the derivative expires or is sold, terminated, or exercised, the cash flow hedge is dedesignated because a forecasted transaction is not probable of occurring, or management determines to remove the designation of the cash flow hedge. The Company does not enter into derivative instruments for any purpose other than cash flow hedging. The Company does not speculate using derivative instruments.
48
CLARUS CORPORATION
NOTES TO CONSOLIDATED FINANCIAL STATEMENTS - CONTINUED
(in thousands, except per share amounts)
Stock-Based Compensation
The Company records compensation expense for all share-based awards granted based on the fair value of the award at the time of the grant. The fair value of each option award is estimated on the date of grant using the Black-Scholes option pricing model that uses assumptions and estimates that the Company believes are reasonable. Stock-based compensation costs for stock awards and restricted stock awards is measured based on the closing market value of the Company’s common stock on the date of the grant. For restricted stock awards subject to market conditions, the fair value of each restricted stock award has been estimated as of the date of grant using the Monte-Carlo pricing model. The Company recognizes the cost of the share-based awards on a straight-line basis over the requisite service period of the award and recognizes forfeitures in the period they occur. Stock options granted have contractual terms of up to ten years. Upon exercise of stock options or vesting of restricted stock awards, the Company issues shares from those authorized and reserved for issuance.
Revenue Recognition
The Company recognizes revenue when a contract exists with a customer that specifies the goods and services to be provided at an agreed upon sales price and when the performance obligation is satisfied by transferring the goods or service to the customer. The performance obligation is considered complete when control transfers, which is determined when products are shipped or delivered to the customer depending on the terms of the contract. Sales are made on normal and customary short-term credit terms or upon delivery of point of sale transactions.
The Company enters into contractual arrangement with customers in the form of individual customer orders which specify the goods, quantity, pricing, and associated order terms. The Company does not have long-term contracts that are satisfied over time. Due to the nature of the contracts, no significant judgment exists in relation to the identification of the customer contract, satisfaction of the performance obligation, or transaction price. The Company expenses incremental costs of obtaining a contract due to the short-term nature of the contracts.
The Company’s contract terms or historical business practices can give rise to variable consideration such as term discounts and customer cooperative payments. We estimate the expected term discounts based on an analysis of historical experience and record cash discounts as a reduction to revenue. Through cooperative advertising programs, the Company reimburses its wholesale customers for some of their costs of advertising the Company’s products. The Company records such costs as a reduction of revenue, where the fair value cannot be reasonably estimated or where costs exceed the fair value of the services.
At the time of revenue recognition, we also provide for estimated sales returns and miscellaneous claims from customers as reductions to revenues. The estimates are based on historical rates of product returns and claims. The Company accrues for such estimated returns and claims with an estimated accrual and associated reduction of revenue. Additionally, the Company records inventory that it expects to be returned as an other current asset, with a corresponding reduction of cost of goods sold.
Sales commissions are expensed as incurred as they are paid within a year. These costs are recorded in selling, general and administrative. Taxes collected from customers and remitted to government authorities are reported on the net basis and are excluded from sales.
Contract liabilities are recorded as a component of accounts payable and accrued liabilities when customers remit contractual cash payments in advance of us satisfying performance obligations which are satisfied at a future point of time. Contract liabilities totaled $141 and $90 at December 31, 2019 and 2018, respectively. Contract liabilities are derecognized when the performance obligation is satisfied. Revenue recognized from satisfaction of performance obligations relating to the advanced payments during the year ended December 31, 2019 and 2018 totaled $90 and $554, respectively.
49
CLARUS CORPORATION
NOTES TO CONSOLIDATED FINANCIAL STATEMENTS - CONTINUED
(in thousands, except per share amounts)
Cost of Sales
The expenses that are included in cost of sales include all direct product costs and costs related to shipping, certain warehousing or handling, duties and importation fees. Product warranty costs and specific provisions for excess, close-out, or slow-moving inventory are also included in cost of sales. Certain warehousing or handling costs which are not associated with the manufacturing of goods for sale are excluded from cost of sales.
Selling, General and Administrative Expense
Selling, general and administrative expense includes personnel-related costs, product development, selling, advertising, visual merchandise, depreciation and amortization, and other general operating expenses. Advertising costs are expensed in the period incurred. Total advertising expense, including cooperative advertising costs, were $4,588, $4,016, and $3,951 for the years ended December 31, 2019, 2018, and 2017, respectively.
Through cooperative advertising programs, the Company reimburses its wholesale customers for some of their costs of advertising the Company’s products based on various criteria, including the value of purchases from the Company and various advertising specifications. Cooperative advertising costs were $287, $338, and $537 for the years ended December 31, 2019, 2018, and 2017, respectively, and were included in selling, general, and administrative expense because the Company receives an identifiable benefit in exchange for the cost, the advertising may be obtained from a party other than the customer, and the fair value of the advertising benefit can be reasonably estimated.
Product Warranty
Some of the Company’s products carry warranty provisions for defects in quality and workmanship. Warranty repairs and replacements are recorded in cost of sales and a warranty liability is established at the time of sale to cover estimated costs based on the Company’s history of warranty repairs and replacements. The Company recorded a liability for product warranties totaling $1,155 and $1,032 as of December 31, 2019 and 2018, respectively. For the years ended December 31, 2019, 2018, and 2017, the Company experienced warranty claims on its products of $1,123, $999, and $949, respectively.
Research and Development
Research and development costs are charged to expense as incurred, and are included in selling, general and administrative expenses in the accompanying consolidated statements of comprehensive income. Total research and development costs were $10,575, $9,471, and $7,984 for the years ended December 31, 2019, 2018, and 2017, respectively.
Income Taxes
Income taxes are accounted for under the asset and liability method. Income taxes are based on amounts of taxes payable or refundable in the current year and on expected future tax consequences of events that are recognized in the financial statements in different periods than they are recognized in tax returns. As a result of timing of recognition and measurement differences between financial accounting standards and income tax laws, temporary differences arise between amounts of pre-tax financial statement income and taxable income and between reported amounts of assets and liabilities in the consolidated balance sheets and their respective tax bases. Deferred income tax assets and liabilities reported in the consolidated balance sheets reflect estimated future tax effects attributable to these temporary differences and to net operating loss and net capital loss carryforwards, based on enacted tax rates expected to be in effect for years in which the differences are expected to be settled or realized. The Company has netted these deferred tax assets and deferred tax liabilities by jurisdiction. Realization of deferred tax assets is dependent on future taxable income in specific jurisdictions. Valuation allowances are used to reduce deferred tax assets to amounts considered more-likely-than-not to be realized. U.S. deferred income taxes are not provided on undistributed income of foreign subsidiaries where such earnings are considered to be permanently invested.
The Company releases residual tax effects in accumulated other comprehensive income (loss) through continuing operations as the underlying asset matures or expires. The Company recognizes interest expense and penalties related to income tax matters in income tax (benefit) expense.
The Company recognizes tax benefits from uncertain tax positions only if it is more likely than not that the tax position will be sustained on examination by the taxing authorities based on the technical merits of the position. The tax benefits recognized in the financial statements from such a position are measured based on the largest benefit that has a greater than fifty percent likelihood of being realized upon ultimate resolution. The Company recognizes interest and penalties related to unrecognized tax benefits in income tax (benefit) expense. Unrecognized tax benefits that reduce a net operating loss, similar tax loss or tax credit carryforward, are presented as a reduction to deferred income taxes.
50
CLARUS CORPORATION
NOTES TO CONSOLIDATED FINANCIAL STATEMENTS - CONTINUED
(in thousands, except per share amounts)
Concentration of Credit Risk and Sales
Financial instruments that potentially subject the Company to concentration of credit risk consist principally of cash, accounts receivable, and aggregate unrealized gains (losses) on derivative contracts. Risks associated with cash within the United States are mitigated by banking with federally insured, creditworthy institutions; however, there are balances with these institutions that are greater than the Federal Deposit Insurance Corporation insurance limit. The Company performs ongoing credit evaluations of its customers and maintains allowances for possible losses as considered necessary by management.
During the years ended December 31, 2019, 2018 and 2017, Recreational Equipment, Inc. (“REI”) accounted for approximately 14%, 12% and 14%, respectively, of the Company’s sales and is included in the Black Diamond segment. No other single customer contributed more than 10% of our sales during those periods. As of December 31, 2019 and 2018, REI accounted for approximately 14% and 15% of the Company’s accounts receivable, respectively.
Fair Value Measurements
The carrying value of cash, accounts receivable, accounts payable and accrued liabilities approximate their respective fair values due to the short-term nature and liquidity of these financial instruments. Derivative financial instruments are recorded at fair value based on current market pricing models. The Company estimates that, due to the variable interest rates reflecting current market rates, the fair value of its long-term debt obligations under its revolving credit facility approximates the carrying value at December 31, 2019 and 2018.
Segment Information
We operate our business structure within two segments. These segments are defined based on the internal financial reporting used by management. Certain significant selling and general and administrative expenses are not allocated to the segments. The accounting policies of the segments are the same as those described above.
Recent Accounting Pronouncements
Accounting Pronouncements adopted During 2019
On January 1, 2019, the Company adopted ASC Topic 842, Leases, and elected the prospective method which was applied to all leases in effect as of January 1, 2019. Results for reporting periods beginning after January 1, 2019 are presented under the new guidance, while prior period amounts are not adjusted and continue to be presented in accordance with ASC Topic 840, Leases.
Under the new guidance, lessees are required to recognize a lease liability and a ROU asset for all leases with terms greater than 12 months. Leases are now classified as either finance or operating, with classification affecting the pattern of expense recognition in the income statement. Classification is based upon the underlying asset’s existence, nature and timing of ownership transfer in the related lease. Leases previously defined as operating leases record lease expense based upon the related ROU asset amortization and lease liability interest expense using the interest method over the life of the lease. Leases previously defined as capital leases are now classified as a finance lease with no material changes to the accounting methodology.
Upon adoption of ASC 842, the Company recorded the present value of ROU assets and related lease liabilities for the Company’s outstanding operating leases over the remaining lease term at January 1, 2019 totaling $1,516.
Certain of the leases contain extension options of one to five years. At January 1, 2019, the Company is uncertain as to whether the extension options will be executed. Accordingly, no extension options were considered in the present value computations of the ROU assets or related lease liabilities.
The Company elected the package of practical expedients in transition for leases that commenced prior to January 1, 2019, whereby these contracts were not reassessed or reclassified from their previous assessments as of December 31, 2018. We also elected certain other practical expedients in transition, including not reassessing existing land easements as lease contracts. The Company has also elected to not record the ROU assets and related liabilities for outstanding leases as of January 1, 2019 with a remaining term of 12 months or less. In these cases, the Company recognizes a lease payment as an expense on a straight-line basis. See Note 16. Leases for the financial position impact and additional disclosures.
51
CLARUS CORPORATION
NOTES TO CONSOLIDATED FINANCIAL STATEMENTS - CONTINUED
(in thousands, except per share amounts)
On January 1, 2019, the Company early adopted Accounting Standards Update (“ASU”) 2017-04, Intangibles-Goodwill and Other (Topic 350): Simplifying the Test for Goodwill Impairment as permitted. The standard simplifies the accounting for goodwill impairment by requiring a goodwill impairment to be measured using a single step impairment model, whereby the impairment equals the difference between the carrying amount and the fair value of the specified reporting units in their entirety. This eliminates the second step of the current impairment model that requires companies to first estimate the fair value of all assets in a reporting unit and measure impairments based on those fair values and a residual measurement approach. It also specifies that any loss recognized should not exceed the total amount of goodwill allocated to that reporting unit. This ASU was adopted on a prospective basis with no impact to the Company’s consolidated financial statements.
On January 1, 2019, the Company adopted ASU 2017-12, Derivatives and Hedging (Topic 815): Targeted Improvements to Accounting for Hedging Activities. The ASU was adopted on a prospective basis. This standard enables entities to better portray the economics of their risk management activities in the financial statements and enhances the transparency and understandability of hedge results through improved disclosures. The adoption of this guidance did not impact the Company’s consolidated financial statements and related disclosures.
On January 1, 2019, the Company adopted ASU 2018-02, Income Statement – Reporting Comprehensive Income (Topic 220) Reclassification of Certain Tax Effects from Accumulated Other Comprehensive Income which allows for a reclassification from accumulated other comprehensive (loss) income to retained earnings for stranded tax effects resulting from the Tax Act. However, because the amendments only relate to the reclassification of the income tax effects of the Tax Act, the underlying guidance that requires that the effect of a change in tax laws or rates be included in income from continuing operations is not affected. Adoption of this ASU did not impact the beginning retained earnings on January 1, 2019 or the Company’s consolidated financial statements and related disclosures.
NOTE 2. ACQUISITIONS
On August 21, 2017, the Company acquired 100% of the outstanding membership interests of Sierra Bullets, L.L.C., a manufacturer of a wide range of bullets primarily for both rifles and pistols, pursuant to the terms of the purchase and sale agreement dated August 21, 2017 (the “Purchase Agreement”). Under the terms of the Purchase Agreement, the Company acquired Sierra for an aggregate purchase price of $79,000, plus or minus a working capital adjustment, in accordance with and subject to the terms and conditions set forth in the Purchase Agreement. During the measurement period, the Company finalized the working capital adjustment and adjusted the recorded purchase consideration and goodwill by $345.
The Company believes the acquisition of Sierra is expected to provide the Company with the following benefits:
| · | greater combined global revenue base; |
| · | increased diversification and seasonal balance; |
| · | increased gross margins, profitability and free cash flows; |
| · | advance the development, marketing and distribution of products; and |
| · | access to increased liquidity to further acquire and grow businesses. |
The following table is a reconciliation to the fair value of the purchase consideration and how the purchase consideration is allocated to assets acquired and liabilities assumed which have been estimated at their fair values. The excess of purchase consideration over the assets acquired and liabilities assumed is recorded as goodwill.
52
CLARUS CORPORATION
NOTES TO CONSOLIDATED FINANCIAL STATEMENTS - CONTINUED
(in thousands, except per share amounts)
| Estimated Fair Value | ||||
| Total Purchase Consideration | $ | 79,239 | ||
| Assets Acquired and Liabilities Assumed | ||||
| Assets | ||||
| Cash | $ | 1 | ||
| Accounts receivable | 2,686 | |||
| Inventories | 12,299 | |||
| Prepaid and other current assets | 128 | |||
| Property and equipment | 13,292 | |||
| Amortizable other intangible assets | 15,500 | |||
| Identifiable indefinite lived intangible assets | 18,900 | |||
| Goodwill | 17,745 | |||
| Other long-term assets | 15 | |||
| Total Assets | 80,566 | |||
| Liabilities | ||||
| Accounts payable and accrued liabilities | 1,327 | |||
| Total Liabilities | 1,327 | |||
| Net Book Value Acquired | $ | 79,239 | ||
The gross amount of accounts receivable is $2,732 of which $46 is deemed to be not collectible. The estimated fair value of inventory was recorded at expected sales price less cost to sell plus a reasonable profit margin for selling efforts.
In connection with the acquisition, the Company acquired exclusive rights to Sierra’s trade names and trademarks, customer relationships, and product technologies. The amounts assigned to each class of intangible asset, other than goodwill acquired, and the related weighted average useful lives are as follows:
| Weighted Average | ||||||
| Gross | Useful Life | |||||
| Intangibles subject to amortization | ||||||
| Customer relationships | $ | 11,900 | 15.0 years | |||
| Product technologies | 2,500 | 10.0 years | ||||
| Trade name / trademark | 1,100 | 10.0 years | ||||
| Intangibles not subject to amortization | ||||||
| Trade names and trademarks | 18,900 | N/A | ||||
| $ | 34,400 | 13.8 years | ||||
The weighted-average period before the next renewal of trade names and trademarks not subject to amortization is approximately 4.8 years. The fair value of Sierra’s assembled workforce and buyer-specific synergies has been included in goodwill. According to Revenue Ruling 99-6, the acquisition of a limited liability company is treated as a purchase of assets for tax purposes. As such, the basis in the assets of Sierra is equal for both book and tax, which results in no initial recognition of deferred tax assets or liabilities. Furthermore, the full amount of goodwill recorded of $17,745 is expected to be deductible for tax purposes. No pre-existing relationships existed between Clarus and the Sellers prior to the acquisition.
On November 6, 2018, the Company purchased the assets of SKINourishment and was accounted for as a business combination. The assets purchased were not significant to the consolidated financial statements. Pro forma results of SKINourishment have not been presented as the results are insignificant to our consolidated financial statements. Additionally, revenues and earnings of SKINourishment, since the acquisition date, are insignificant to our consolidated financial statements.
53
CLARUS CORPORATION
NOTES TO CONSOLIDATED FINANCIAL STATEMENTS - CONTINUED
(in thousands, except per share amounts)
Pro Forma Results (Unaudited)
The following pro forma results are based on the individual historical results of the Company and Sierra, with adjustments to give effect as if the acquisition and borrowings used to finance the acquisition had occurred on January 1, 2016, after giving effect to certain adjustments including the amortization of intangible assets, depreciation of fixed assets, the Sellers’ management fees, interest expense and taxes and assumes the purchase price was allocated to the assets purchased and liabilities assumed based on their fair market values at the date of purchase.
| Year Ended December 31, | ||||
| 2017 | ||||
| Sales | $ | 191,187 | ||
| Net income | $ | 6,604 | ||
| Net income per share - basic | $ | 0.22 | ||
| Net income per share - diluted | $ | 0.22 | ||
The pro forma information is presented for illustrative purposes only and is not necessarily indicative of the operating results that would have occurred had the transaction been consummated as of January 1, 2016. Furthermore, such pro forma information is not necessarily indicative of future operating results of the combined companies and should not be construed as representative of the operating results of the combined companies for any future dates or periods.
Material nonrecurring adjustments excluded from the pro forma financial information above consists of $2,170 transaction and merger and integration costs and the $3,147 step up of Sierra inventory to its preliminary fair value, which was recorded as an unfavorable adjustment to cost of goods sold during the six months following the acquisition date.
NOTE 3. INVENTORIES
Inventories, as of December 31, 2019 and 2018, were as follows:
| December 31, | ||||||||
| 2019 | 2018 | |||||||
| Finished goods | $ | 59,452 | $ | 51,626 | ||||
| Work-in-process | 7,474 | 6,221 | ||||||
| Raw materials and supplies | 6,506 | 7,086 | ||||||
| $ | 73,432 | $ | 64,933 | |||||
54
CLARUS CORPORATION
NOTES TO CONSOLIDATED FINANCIAL STATEMENTS - CONTINUED
(in thousands, except per share amounts)
NOTE 4. PROPERTY AND EQUIPMENT
Property and equipment, net as of December 31, 2019 and 2018, were as follows:
| December 31, | ||||||||
| 2019 | 2018 | |||||||
| Land | $ | 3,160 | $ | 3,160 | ||||
| Building and improvements | 6,964 | 6,870 | ||||||
| Furniture and fixtures | 5,255 | 4,376 | ||||||
| Computer hardware and software | 5,298 | 4,863 | ||||||
| Machinery and equipment | 21,578 | 21,004 | ||||||
| Construction in progress | 1,690 | 1,761 | ||||||
| 43,945 | 42,034 | |||||||
| Less accumulated depreciation | (21,026 | ) | (18,633 | ) | ||||
| $ | 22,919 | $ | 23,401 | |||||
Depreciation expense was $4,550, $4,423, and $2,883 for the years ended December 31, 2019, 2018, and 2017, respectively.
NOTE 5. GOODWILL AND OTHER INTANGIBLE ASSETS
Goodwill
The following table summarizes the changes in goodwill by segment:
| Black Diamond | Sierra | Total | ||||||||||
| Balance at December 31, 2017 | $ | - | $ | 17,745 | $ | 17,745 | ||||||
| Increase due to working capital adjustment | - | 345 | 345 | |||||||||
| Balance at December 31, 2018 | $ | - | $ | 18,090 | $ | 18,090 | ||||||
| Balance at December 31, 2019 | $ | - | $ | 18,090 | $ | 18,090 | ||||||
Indefinite Lived Intangible Assets
The following table summarizes the changes in indefinite lived intangible assets:
| Balance at December 31, 2018 | $ | 41,694 | ||
| Impact of foreign currency exchange rates | (64 | ) | ||
| Balance at December 31, 2019 | $ | 41,630 |
55
CLARUS CORPORATION
NOTES TO CONSOLIDATED FINANCIAL STATEMENTS - CONTINUED
(in thousands, except per share amounts)
Other Intangible Assets, net
The following table summarizes the changes in gross other intangible assets:
| Gross balance at December 31, 2018 | $ | 33,010 | ||
| Impact of foreign currency exchange rates | (93 | ) | ||
| Gross balance at December 31, 2019 | $ | 32,917 | ||
Other intangible assets, net of amortization as of December 31, 2019 and 2018, were as follows:
| December 31, 2019 | ||||||||||||||||
| Gross | Accumulated Amortization | Net | Weighted Average Useful Life | |||||||||||||
| Intangibles subject to amortization | ||||||||||||||||
| Customer relationships | $ | 25,995 | $ | (13,392 | ) | $ | 12,603 | 15.2 years | ||||||||
| Product technologies | 4,712 | (2,416 | ) | 2,296 | 11.9 years | |||||||||||
| Tradename / trademark | 1,263 | (386 | ) | 877 | 9.4 years | |||||||||||
| Core technologies | 947 | (907 | ) | 40 | 10.0 years | |||||||||||
| $ | 32,917 | $ | (17,101 | ) | $ | 15,816 | 14.3 years | |||||||||
| December 31, 2018 | ||||||||||||||||
| Gross | Accumulated Amortization | Net | Weighted Average Useful Life | |||||||||||||
| Intangibles subject to amortization | ||||||||||||||||
| Customer relationships | $ | 26,047 | $ | (10,710 | ) | $ | 15,337 | 15.2 years | ||||||||
| Product technologies | 4,753 | (1,853 | ) | 2,900 | 11.9 years | |||||||||||
| Tradename / trademark | 1,263 | (218 | ) | 1,045 | 9.4 years | |||||||||||
| Core technologies | 947 | (813 | ) | 134 | 10.0 years | |||||||||||
| $ | 33,010 | $ | (13,594 | ) | $ | 19,416 | 14.3 years | |||||||||
Amortization expense for the years ended December 31, 2019, 2018, and 2017, was $3,552, $3,873, and $2,376, respectively. Future amortization expense for other intangible assets as of December 31, 2019 is as follows:
| Years Ending December 31, | Amortization Expense | |||
| 2020 | $ | 3,039 | ||
| 2021 | 2,621 | |||
| 2022 | 2,311 | |||
| 2023 | 2,041 | |||
| 2024 | 1,802 | |||
| Thereafter | 4,002 | |||
| $ | 15,816 | |||
56
CLARUS CORPORATION
NOTES TO CONSOLIDATED FINANCIAL STATEMENTS - CONTINUED
(in thousands, except per share amounts)
NOTE 6. LONG-TERM DEBT
Long-term debt as of December 31, 2019 and 2018, was as follows:
| December 31, | ||||||||
| 2019 | 2018 | |||||||
| Revolving credit facility (a) | $ | 22,670 | $ | 22,062 | ||||
| Other | - | 84 | ||||||
| 22,670 | 22,146 | |||||||
| Less current portion | - | (41 | ) | |||||
| $ | 22,670 | $ | 22,105 | |||||
| (a) | As of December 31, 2019, the Company had drawn $22,670 on the $60,000 revolving commitment that was available under the credit agreement with JPMorgan Chase Bank, N.A., with a maturity date of May 3, 2024. |
On May 3, 2019, the Company together with certain of its direct and indirect domestic subsidiaries (the “Borrowers”) and the other loan parties party thereto entered into a Credit Agreement with JPMorgan Chase Bank, N.A., as administrative agent, and the lenders from time to time party thereto, for borrowings of up to $60,000 under a revolving credit facility (including up to $5,000 for letters of credit), and borrowings of up to $40,000 under a term loan facility that is available to be drawn until May 3, 2020. The Credit Agreement also permits the Borrowers, subject to certain requirements, to arrange with lenders for an aggregate of up to $50,000 of additional revolving and/or term loan commitments (both of which are currently uncommitted), for potential aggregate revolving and term loan commitments under the Credit Agreement of up to $150,000. The Credit Agreement matures on May 3, 2024.
The Borrowers may elect to have the revolving and term loans under the Credit Agreement bear interest at an alternate base rate or a Eurodollar rate plus an applicable rate. The applicable rate for these borrowings will range from 0.50% to 1.25% per annum, in the case of alternate base rate borrowings, and 1.50% to 2.25% per annum, in the case of Eurodollar borrowings. The applicable rate was initially 0.875% per annum, in the case of alternate base rate borrowings, and 1.875% per annum, in the case of Eurodollar borrowings, however, it may be adjusted from time to time based upon the level of the Company’s consolidated total leverage ratio. The Credit Agreement also requires the Borrowers to pay a commitment fee on the unused portion of the revolving and term loan commitments. Such commitment fee will range between 0.15% and 0.25% per annum, and is also based upon the level of the Company’s consolidated total leverage ratio. The Company pays interest monthly on any borrowings on the Credit Agreement. As of December 31, 2019, the rate was 3.3125%.
All obligations under the Credit Agreement are secured by 100% of our domestic, and 65% of our foreign, subsidiary equity interests, as well as accounts receivable, inventory, intellectual property and certain other assets owned by the Company. The Credit Agreement contains restrictions on the Company’s ability to pay dividends or make distributions or other restricted payments if certain conditions in the Credit Agreement are not fulfilled. The Credit Agreement includes customary affirmative and negative covenants, including financial covenants relating to the Company’s consolidated total leverage ratio and fixed charge coverage ratio. The Company was in compliance with the debt covenants set forth in the Credit Agreement as of December 31, 2019.
On May 3, 2019, concurrent with entering into the Credit Agreement, the Company’s previous credit facility with JPMorgan Chase Bank, N.A. (the “2018 Credit Agreement”), which provided for a revolving commitment of up to $75,000, was paid in full and terminated. The Company paid interest monthly on any borrowings on the 2018 Credit Agreement at London Inter-bank Offered Rate (“LIBOR”) plus 1.5% (3.8493% as of December 31, 2018), and an annual commitment fee of 0.25% on the unused portion of the commitment.
57
CLARUS CORPORATION
NOTES TO CONSOLIDATED FINANCIAL STATEMENTS - CONTINUED
(in thousands, except per share amounts)
The aggregate maturities of the revolving credit facility for the years subsequent to December 31, 2019 are as follows:
| 2020 | $ | - | ||
| 2021 | - | |||
| 2022 | - | |||
| 2023 | - | |||
| 2024 | 22,670 | |||
| Total future long-term debt payments | 22,670 | |||
| Less current portion | - | |||
| Long-term debt obligations | $ | 22,670 | ||
NOTE 7. DERIVATIVE FINANCIAL INSTRUMENTS
The Company’s primary exchange rate risk management objective is to mitigate the uncertainty of anticipated cash flows attributable to changes in foreign currency exchange rates. The Company primarily focuses on mitigating changes in cash flows resulting from sales denominated in currencies other than the U.S. dollar. The Company manages this risk primarily by using currency forward and option contracts. If the anticipated transactions are deemed probable, the resulting relationships are formally designated as cash flow hedges. The Company accounts for these contracts as cash flow hedges and tests effectiveness by determining whether changes in the expected cash flow of the derivative offset, within a range, changes in the expected cash flow of the hedged item.
At December 31, 2019, the Company’s derivative contracts had remaining maturities of less than one and one-half years. The counterparty to these transactions had both long-term and short-term investment grade credit ratings. The maximum net exposure of the Company’s credit risk to the counterparty is generally limited to the aggregate unrealized loss of all contracts with that counterparty. At December 31, 2019, there was no such exposure to the counterparty. The Company’s exposure of counterparty credit risk is limited to the aggregate unrealized gain of $45 on all contracts at December 31, 2019. The Company’s derivative counterparty has strong credit ratings and as a result, the Company does not require collateral to facilitate transactions.
The Company held the following contracts designated as hedged instruments as of December 31, 2019 and 2018:
| December 31, 2019 | ||||||||
| Notional | Latest | |||||||
| Amount | Maturity | |||||||
| Foreign exchange contracts - Canadian Dollars | $ | 15,932 | February 2021 | |||||
| Foreign exchange contracts - Euros | € | 18,168 | February 2021 | |||||
| Foreign exchange contracts - Swiss Francs | CHF 661 | August 2020 | ||||||
| December 31, 2018 | ||||||||
| Notional | Latest | |||||||
| Amount | Maturity | |||||||
| Foreign exchange contracts - Canadian Dollars | $ | 6,166 | August 2019 | |||||
| Foreign exchange contracts - Euros | € | 10,710 | February 2020 | |||||
For contracts that qualify as effective hedge instruments, the effective portion of gains and losses resulting from changes in fair value of the instruments are included in accumulated other comprehensive (loss) income and reclassified to sales in the period the underlying hedged transaction is recognized. Gains of $1,017 and $256 were reclassified to sales during the years ended December 31, 2019 and 2018, respectively.
58
CLARUS CORPORATION
NOTES TO CONSOLIDATED FINANCIAL STATEMENTS - CONTINUED
(in thousands, except per share amounts)
The following table presents the balance sheet classification and fair value of derivative instruments as of December 31, 2019 and 2018:
| Classification | December 31, 2019 | December 31, 2018 | ||||||||
| Derivative instruments in asset positions: | ||||||||||
| Forward exchange contracts | Prepaid and other current assets | $ | 226 | $ | 729 | |||||
| Derivative instruments in liability positions: | ||||||||||
| Forward exchange contracts | Accounts payable and accrued liabilities | $ | 152 | $ | - | |||||
| Forward exchange contracts | Other long-term liabilities | $ | 29 | $ | 5 | |||||
NOTE 8. ACCUMULATED OTHER COMPREHENSIVE (LOSS) INCOME
Accumulated other comprehensive (loss) income (“AOCI”) primarily consists of foreign currency translation adjustments and changes in our forward foreign exchange contracts. The components of AOCI, net of tax, were as follows:
| Foreign Currency Translation Adjustments | Unrealized Gains (Losses) on Cash Flow Hedges | Total | ||||||||||
| Balance as of December 31, 2017 | $ | 905 | $ | (406 | ) | $ | 499 | |||||
| Other comprehensive (loss) income before reclassifications | (1,031 | ) | 1,382 | 351 | ||||||||
| Amounts reclassified from other comprehensive income (loss) | 199 | (572 | ) | (373 | ) | |||||||
| Net current period other comprehensive (loss) income | (832 | ) | 810 | (22 | ) | |||||||
| Balance as of December 31, 2018 | 73 | 404 | 477 | |||||||||
| Other comprehensive (loss) income before reclassifications | (359 | ) | 487 | 128 | ||||||||
| Amounts reclassified from other comprehensive income (loss) | - | (908 | ) | (908 | ) | |||||||
| Net current period other comprehensive loss | (359 | ) | (421 | ) | (780 | ) | ||||||
| Balance as of December 31, 2019 | $ | (286 | ) | $ | (17 | ) | $ | (303 | ) | |||
The effects on net income of amounts reclassified from unrealized gains (losses) on cash flow hedges for foreign exchange contracts and foreign currency translation adjustments for the years ended December 31, 2019 and 2018 were as follows:
59
CLARUS CORPORATION
NOTES TO CONSOLIDATED FINANCIAL STATEMENTS - CONTINUED
(in thousands, except per share amounts)
| Gains (losses) reclassified from AOCI to the Consolidated Statements of Comprehensive Income | ||||||||
| Affected line item in the Consolidated | Year ended December 31, | |||||||
| Statements of Comprehensive Income | 2019 | 2018 | ||||||
| Foreign exchange contracts: | ||||||||
| Sales | $ | 1,017 | $ | 256 | ||||
| Less: Income tax expense (benefit) | 109 | (316 | ) | |||||
| Amount reclassified, net of tax | $ | 908 | $ | 572 | ||||
| Foreign currency translation adjustments: | ||||||||
| Other, net | - | (199 | ) | |||||
| Total reclassifications from AOCI | $ | 908 | $ | 373 | ||||
The Company’s policy is to classify reclassifications of cumulative foreign currency translation from AOCI to Other, net.
NOTE 9. FAIR VALUE MEASUREMENTS
We measure certain financial assets and liabilities at fair value on a recurring basis. Fair value is defined as an exit price, representing the amount that would be received to sell an asset or paid to transfer a liability in an orderly transaction between market participants, under a three-tier fair value hierarchy which prioritizes the inputs used in measuring fair value as follows:
| Level 1- | inputs to the valuation methodology are quoted market prices for identical assets or liabilities in active markets. |
| Level 2- | inputs to the valuation methodology include quoted prices in markets that are not active or model inputs that are observable either directly or indirectly for substantially the full term of the asset or liability. |
| Level 3- | inputs to the valuation methodology are based on prices or valuation techniques that are unobservable. |
Assets and liabilities measured at fair value on a recurring basis at December 31, 2019 and 2018 were as follows:
| December 31, 2019 | ||||||||||||||||
| Level 1 | Level 2 | Level 3 | Total | |||||||||||||
| Assets | ||||||||||||||||
| Forward exchange contracts | $ | - | $ | 226 | $ | - | $ | 226 | ||||||||
| $ | - | $ | 226 | $ | - | $ | 226 | |||||||||
| Liabilities | ||||||||||||||||
| Forward exchange contracts | $ | - | $ | 181 | $ | - | $ | 181 | ||||||||
| $ | - | $ | 181 | $ | - | $ | 181 | |||||||||
| December 31, 2018 | ||||||||||||||||
| Level 1 | Level 2 | Level 3 | Total | |||||||||||||
| Assets | ||||||||||||||||
| Forward exchange contracts | $ | - | $ | 729 | $ | - | $ | 729 | ||||||||
| $ | - | $ | 729 | $ | - | $ | 729 | |||||||||
| Liabilities | ||||||||||||||||
| Forward exchange contracts | $ | - | $ | 5 | $ | - | $ | 5 | ||||||||
| $ | - | $ | 5 | $ | - | $ | 5 | |||||||||
60
CLARUS CORPORATION
NOTES TO CONSOLIDATED FINANCIAL STATEMENTS - CONTINUED
(in thousands, except per share amounts)
Derivative financial instruments are recorded at fair value based on current market pricing models. No nonrecurring fair value measurements existed at December 31, 2019 and 2018.
NOTE 10. EARNINGS (LOSS) PER SHARE
Basic earnings (loss) per share is computed by dividing earnings (loss) by the weighted average number of common shares outstanding during each period. Diluted earnings (loss) per share is computed by dividing earnings (loss) by the total of the weighted average number of shares of common stock outstanding during each period, plus the effect of dilutive outstanding stock options and unvested restricted stock grants. Potentially dilutive securities are excluded from the computation of diluted earnings per share if their effect is anti-dilutive to the loss from continuing operations.
The following table is a reconciliation of basic and diluted shares of common stock outstanding used in the calculation of earnings per share:
| Year Ended December 31, | ||||||||||||
| 2019 | 2018 | 2017 | ||||||||||
| Weighted average shares outstanding - basic | 29,820 | 29,915 | 30,022 | |||||||||
| Effect of dilutive stock awards | 1,173 | 340 | - | |||||||||
| Weighted average shares outstanding - diluted | 30,993 | 30,255 | 30,022 | |||||||||
| Net income (loss) per share: | ||||||||||||
| Basic | $ | 0.64 | $ | 0.24 | $ | (0.02 | ) | |||||
| Diluted | 0.61 | 0.24 | (0.02 | ) | ||||||||
For the years ended December 31, 2019, 2018, and 2017, equity awards of 702, 1,164, and 3,009, respectively, were outstanding and anti-dilutive and therefore not included in the calculation of net income (loss) per share for these periods.
NOTE 11. STOCK-BASED COMPENSATION PLAN
Under the Company’s current 2015 Stock Incentive Plan (the “2015 Plan”), the Company’s Board of Directors (the “Board of Directors”) has flexibility to determine the type and amount of awards to be granted to eligible participants, who must be employees, directors, officers or consultants of the Company or its subsidiaries. The 2015 Plan allows for grants of incentive stock options, nonqualified stock options, restricted stock awards, stock appreciation rights, and restricted units. The aggregate number of shares of common stock that may be granted through awards under the 2015 Plan to any employee in any calendar year may not exceed 500 shares. The 2015 Plan will continue in effect until December 2025 unless terminated sooner. As of December 31, 2019, the number of shares authorized and reserved for issuance under the 2015 Plan is 6,655 shares, subject to automatic annual increase equal to 5% of the total number of shares of the Company’s outstanding common stock.
Options Granted:
During the year ended December 31, 2019, the Company issued stock options for an aggregate of 188 shares under the 2015 Plan to directors and employees of the Company. Of the 188 options issued, 38 options vest in four equal consecutive quarterly tranches from the date of grant. The remaining 150 options issued vest in three equal tranches on June 5, 2020, 2021 and 2022.
For computing the fair value of the stock-based awards, the fair value of each option grant has been estimated as of the date of grant using the Black-Scholes option-pricing model with the following assumptions:
61
CLARUS CORPORATION
NOTES TO CONSOLIDATED FINANCIAL STATEMENTS - CONTINUED
(in thousands, except per share amounts)
| 2019 | 2018 | 2017 | ||||||
| Number of options | 188 | 1,938 | 363 | 100 | ||||
| Option vesting period | 1 - 3 Years | 1 - 5 Years | 1-2 Years | Immediate | ||||
| Grant price | $13.21 | $6.80 - $10.21 | $6.10 - $6.15 | $6.10 | ||||
| Dividend yield | 0.76% | 0.00% - 1.09% | 0.00% | 0.00% | ||||
| Expected volatility (a) | 41.0% - 41.2% | 40.6% - 42.5% | 41.9% - 42.2% | 46.90% | ||||
| Risk-free interest rate | 1.88% - 1.93% | 2.65% - 3.09% | 1.80% | 1.41% | ||||
| Expected life (years) (b) | 5.31 - 6.00 | 5.00 - 6.50 | 5.31 - 5.33 | 2.75 | ||||
| Weighted average fair value | $4.87 - $5.13 | $2.77 - $4.08 | $2.45 - $2.49 | $1.20 | ||||
| (a) | Expected volatility is based upon the Company’s historical volatility. |
| (b) | Because the Company does not have sufficient historical exercise data to provide a reasonable basis upon which to estimate the expected term for these grants, the Company utilized the simplified method in developing an estimate of the expected term of these options. |
Using these assumptions, the fair value of the stock options granted during the years ended December 31, 2019, 2018, and 2017 was $952, $6,059, and $1,020, respectively, which will be amortized as stock-based compensation expense over the vesting period of the options.
Market Condition Restricted Shares Granted:
On January 7, 2019, the Company issued and granted to an employee a restricted stock award of 350 restricted shares under the 2015 Plan, that will vest as follows: (A) the stock award will vest and become nonforfeitable if, on or before January 7, 2024, the closing price of the Company’s common stock shall have equaled or exceeded $15.00 per share for twenty consecutive trading days (such 20th day being the “Price Trigger Date”); and (B) once the Price Trigger Date occurs, (i) 117 shares of the Company’s common stock shall vest on each of the first and second anniversary of the Price Trigger Date; and (ii) 116 shares of the Company’s common stock shall vest on the third anniversary of the Price Trigger Date. For computing the fair value of the 350 restricted shares with a market condition, the fair value of each restricted stock award grant has been estimated as of the date of grant using the Monte-Carlo pricing model with the assumptions below.
On January 7, 2019, the Company issued and granted to an employee a restricted stock award of 150 restricted shares under the 2015 Plan, that will vest as follows: (A) the stock award will vest and become nonforfeitable if, on or before January 7, 2024, the closing price of the Company’s common stock shall have equaled or exceeded $15.00 per share for twenty consecutive trading days (such 20th day being the Price Trigger Date); and (B) once the Price Trigger Date occurs, the shares shall equally vest on each of the first, second, third and fourth anniversary of the Price Trigger Date. For computing the fair value of the 150 restricted shares with a market condition, the fair value of each restricted stock award grant has been estimated as of the date of grant using the Monte-Carlo pricing model with the assumptions below.
On June 1, 2017, the Company issued and granted to an employee a restricted stock award of 500 restricted shares under the 2015 Plan, of which (i) 250 restricted shares will vest if, on or before June 1, 2022, the Fair Market Value (as defined in the Plan) of the Company’s common stock shall have equaled or exceeded $10.00 per share for twenty consecutive trading days; and (ii) 250 restricted shares will vest if, on or before June 1, 2022, the Fair Market Value (as defined in the Plan) of the Company’s common stock shall have equaled or exceeded $12.00 per share for twenty consecutive trading days. For computing the fair value of the 500 restricted shares with a market condition, the fair value of each restricted stock award grant has been estimated as of the date of grant using the Monte-Carlo pricing model with the assumptions below.
62
CLARUS CORPORATION
NOTES TO CONSOLIDATED FINANCIAL STATEMENTS - CONTINUED
(in thousands, except per share amounts)
| January 7, 2019 | June 1, 2017 | |||||
| Number issued | 500 | 250 | 250 | |||
| Vesting period | $15.00 stock price target | $10.00 stock price target | $12.00 stock price target | |||
| Grant price | $10.21 | $6.10 | $6.10 | |||
| Expected volatility | 42.4% | 42.4% | 42.4% | |||
| Risk-free interest rate | 2.53% | 1.76% | 1.76% | |||
| Expected term (years) | 4.28 - 5.28 | 1.62 | 2.13 | |||
| Weighted average fair value | $7.92 | $4.30 | $3.68 | |||
Using these assumptions, the fair value of the market condition restricted stock awards granted on January 7, 2019 was approximately $3,753 and June 1, 2017 was approximately $1,995.
The total non-cash stock compensation expense related to stock options and restricted stock awards recorded by the Company was as follows:
| Year Ended December 31, | ||||||||||||
| 2019 | 2018 | 2017 | ||||||||||
| Restricted stock awards | $ | 1,058 | $ | 1,158 | $ | 658 | ||||||
| Stock options | 1,891 | 1,494 | 523 | |||||||||
| Total | $ | 2,949 | $ | 2,652 | $ | 1,181 | ||||||
For the years ended December 31, 2019, 2018, and 2017, the majority of stock-based compensation costs were classified as selling, general and administrative expense. A summary of changes in outstanding options and restricted stock awards during the year ended December 31, 2019 is as follows:
| Options | Weighted Average Exercise Price | Aggregate Intrinsic Value | Restricted Stock Awards | |||||||||||||
| Outstanding at December 31, 2018 | 3,956 | $ | 7.52 | $ | 10,286 | 350 | ||||||||||
| Granted | 188 | 13.21 | 500 | |||||||||||||
| Exercised or vested | (121 | ) | 8.28 | (250 | ) | |||||||||||
| Expired | - | - | - | |||||||||||||
| Cancelled | - | - | - | |||||||||||||
| Forfeited | (112 | ) | 9.41 | - | ||||||||||||
| Outstanding at December 31, 2019 | 3,911 | $ | 7.72 | $ | 22,840 | 600 | ||||||||||
| Options exercisable at December 31, 2019 | 2,702 | 7.61 | $ | 16,075 | ||||||||||||
The following table summarizes the exercise price range, weighted average exercise price, and remaining contractual lives by significant ranges for options outstanding and exercisable as of December 31, 2019:
| Remaining Life In Years | Weighted Average | |||||||||||||||||||
| Exercise Price Range | Outstanding | Exercisable | Outstanding | Exercisable | Exercise Price | |||||||||||||||
| $4.38 - $12.40 | 3,713 | 2,664 | 4.9 | 4.9 | $ | 7.53 | ||||||||||||||
| $12.40 - $13.38 | 198 | 38 | 8.4 | 8.1 | $ | 13.25 | ||||||||||||||
| 3,911 | 2,702 | 5.1 | 5.1 | $ | 7.61 | |||||||||||||||
The intrinsic value of options exercised was $607, $315, and $28 during the years ended December 31, 2019, 2018, and 2017, respectively. The intrinsic value of restricted stock awards vested was $3,252, $2,720, and $0 during the years ended December 31, 2019, 2018, and 2017, respectively. Total fair value of options vested during the years ended December 31, 2019, 2018, and 2017 was $1,610, $1,757, and $1,123, respectively. Total fair value of restricted stock awards vested during the years ended December 31, 2019, 2018, and 2017 was $919, $1,076, and $0, respectively.
63
CLARUS CORPORATION
NOTES TO CONSOLIDATED FINANCIAL STATEMENTS - CONTINUED
(in thousands, except per share amounts)
The fair value of unvested restricted stock awards is determined based on the market price of our shares of common stock on the grant date or using the Monte-Carlo pricing model. As of December 31, 2019, there were 1,209 unvested stock options and unrecognized compensation cost of $4,092 related to unvested stock options, as well as 600 unvested restricted stock awards and unrecognized compensation cost of $2,928 related to unvested restricted stock awards. Unrecognized compensation cost of unvested stock options and restricted stock awards are expected to be recognized over the weighted average period of 2.9 years and 3.6 years, respectively.
NOTE 12. RESTRUCTURING
As part of the conclusion of the Company’s review of strategic alternatives, the Company initiated restructuring activities in efforts to further realign resources within the organization (the “2015 Restructuring Plan”) and completed the plan in 2018 with a final payment in 2019. During the year ended December 31, 2019, 2018 and 2017, we incurred $13, $137 and $160, respectively, of restructuring charges related to the 2015 Restructuring Plan. We have incurred $2,694 of cumulative restructuring charges since the commencement of the 2015 Restructuring Plan.
NOTE 13. COMMITMENTS AND CONTINGENCIES
The Company is involved in various legal disputes and other legal proceedings that arise from time to time in the ordinary course of business. Based on currently available information, the Company does not believe that it is reasonably possible that the disposition of any of the legal disputes the Company or its subsidiaries is currently involved in will have a material adverse effect upon the Company’s consolidated financial condition, results of operations or cash flows. There is a reasonable possibility of loss from contingencies in excess of the amounts accrued by the Company in the accompanying consolidated balance sheets; however, the actual amounts of such possible losses cannot currently be reasonably estimated by the Company at this time. It is possible that, as additional information becomes available, the impact on the Company could have a different effect.
NOTE 14. INCOME TAXES
On December 22, 2017, the U.S. government enacted comprehensive tax legislation commonly referred to as the Tax Cuts and Jobs Act (“Tax Act”). The Company recognized the income tax effects of the Tax Act in its 2017 financial statements in accordance with SEC Staff Accounting Bulletin No. 118 (“SAB 118”), which provides guidance for the application of ASC 740, Income Taxes, in the reporting period in which the Tax Act was signed into law. SAB 118 provides a measurement period that should not extend beyond one year from the Tax Act enactment date for companies to complete the accounting under ASC 740. In accordance with SAB 118, a company must reflect the income tax effects of those aspects of the Tax Act for which the accounting under ASC 740 is complete. The Company finalized all tax positions associated with SAB 118 by filing the 2017 tax return during the year ended December 31, 2018.
The Company’s foreign operations that are considered to be permanently reinvested have statutory tax rates of approximately 25%.
Consolidated income (loss) before income taxes consists of the following:
| Year Ended December 31, | ||||||||||||
| 2019 | 2018 | 2017 | ||||||||||
| U.S. operations | $ | 8,553 | $ | 8,998 | $ | (4,794 | ) | |||||
| Foreign operations | 1,428 | (2,525 | ) | (966 | ) | |||||||
| Income (loss) before income tax | $ | 9,981 | $ | 6,473 | $ | (5,760 | ) | |||||
64
CLARUS CORPORATION
NOTES TO CONSOLIDATED FINANCIAL STATEMENTS - CONTINUED
(in thousands, except per share amounts)
The components of the (benefit) provision for income taxes consist of the following:
| Year Ended December 31, | ||||||||||||
| 2019 | 2018 | 2017 | ||||||||||
| Current: | ||||||||||||
| Federal | $ | (41 | ) | $ | (74 | ) | $ | 255 | ||||
| State and local | 179 | 41 | - | |||||||||
| Foreign | 111 | 295 | 150 | |||||||||
| 249 | 262 | 405 | ||||||||||
| Deferred: | ||||||||||||
| Federal | 1,133 | 2,645 | 16,752 | |||||||||
| State and local | (156 | ) | 326 | (374 | ) | |||||||
| Foreign | 3,273 | (575 | ) | (110 | ) | |||||||
| 4,250 | 2,396 | 16,268 | ||||||||||
| Change in valuation allowance for deferred income taxes | (13,490 | ) | (3,486 | ) | (21,760 | ) | ||||||
| (9,240 | ) | (1,090 | ) | (5,492 | ) | |||||||
| Income tax benefit | $ | (8,991 | ) | $ | (828 | ) | $ | (5,087 | ) | |||
The following is a reconciliation of the statutory federal income tax rate to the effective rate reported in the Company’s financial statements:
| Year Ended December 31, | ||||||||||||
| 2019 | 2018 | 2017 | ||||||||||
| Statutory income tax expense (benefit) | 21.0 | % | 21.0 | % | (34.0 | )% | ||||||
| Increase (decrease) in income taxes resulting from: | ||||||||||||
| Foreign taxes | 0.2 | (0.9 | ) | 1.7 | ||||||||
| State income taxes, net of federal income taxes | 1.9 | 3.4 | (2.3 | ) | ||||||||
| Income tax credits | (5.6 | ) | (6.8 | ) | (5.0 | ) | ||||||
| Incentive stock options | (3.7 | ) | 1.3 | 5.5 | ||||||||
| Change in effective state rate | (0.1 | ) | 0.3 | (1.5 | ) | |||||||
| Deferred tax asset write-off | 31.4 | 21.7 | - | |||||||||
| Translation loss | - | - | (6.9 | ) | ||||||||
| Impact of tax reform | - | - | (105.7 | ) | ||||||||
| Other | 0.7 | 1.1 | 3.3 | |||||||||
| Change in valuation allowance | (135.9 | ) | (53.9 | ) | 56.6 | |||||||
| Income tax benefit | (90.1 | )% | (12.8 | )% | (88.3 | )% | ||||||
The deferred tax asset write-off represents a write-off of a historical investment that is fully offset by a release in the valuation allowance.
Deferred income tax assets and liabilities are determined based on the difference between the financial reporting carrying amounts and tax bases of existing assets and liabilities and operating loss and tax credit carryforwards. Significant components of the Company’s existing deferred income tax assets and liabilities as of December 31, 2019 and 2018 are as follows:
65
CLARUS CORPORATION
NOTES TO CONSOLIDATED FINANCIAL STATEMENTS - CONTINUED
(in thousands, except per share amounts)
| December 31, | ||||||||
| 2019 | 2018 | |||||||
| Deferred tax assets: | ||||||||
| Net operating loss, capital loss amount and research & experimentation credit carryforwards | $ | 40,949 | $ | 44,885 | ||||
| Non-cash compensation | 1,622 | 1,384 | ||||||
| Accrued liabilities | 263 | 282 | ||||||
| Reserves and other | 1,027 | 1,138 | ||||||
| Intangibles | 84 | 233 | ||||||
| 43,945 | 47,922 | |||||||
| Valuation allowance | (28,632 | ) | (42,122 | ) | ||||
| Net deferred tax assets | 15,313 | 5,800 | ||||||
| Deferred tax liabilities: | ||||||||
| Depreciation | (1,091 | ) | (966 | ) | ||||
| Intangibles | (7,542 | ) | (7,628 | ) | ||||
| Other | - | (125 | ) | |||||
| (8,633 | ) | (8,719 | ) | |||||
| Total | $ | 6,680 | $ | (2,919 | ) | |||
The Company has provided a valuation allowance against a portion of the deferred tax assets as of December 31, 2019, because the ultimate realization of those assets does not meet the more likely than not criteria. The majority of the Company’s deferred tax assets consist of net operating loss carryforwards for federal tax purposes. If a change in control were to occur, these could be limited under Section 382 of the Internal Revenue Code of 1986 (“Code”), as amended.
In assessing the realizability of deferred income tax assets, management considers whether it is more likely than not that some portion or all of the deferred income tax assets will not be realized. The ultimate realization of deferred tax assets is dependent upon the generation of future taxable income during the periods in which those temporary differences become deductible and net operating loss and credit carryforwards expire. The estimates and judgments associated with the Company’s valuation allowance on deferred tax assets are considered critical due to the amount of deferred tax assets recorded by the Company on its consolidated balance sheet and the judgment required in determining the Company’s potential for future taxable income. The need for a valuation allowance is reassessed at each reporting period.
As a result of the Tax Act, the U.S. federal corporate tax rate was reduced to 21 percent, effective January 1, 2018. In addition, the corporate Alternative Minimum Tax (“AMT”) was repealed and taxpayers with AMT credit carryovers in excess of their regular tax liability may have credits refunded over multiple years from 2018 to 2022.
For tax years beginning January 1, 2018, net operating losses generated will be carried forward indefinitely, thus creating an indefinite-lived deferred tax asset. However, only 80% of the net operating losses generated after January 1, 2018 may be used to offset future taxable income. Due to these changes in the tax law, management has scheduled out the reversal of deferred tax assets and liabilities to determine the generation of future net operating loss carryforwards with an indefinite reversal period. The resultant indefinite lived net operating loss can only offset 80% of future taxable income generated by indefinite lived deferred tax liabilities.
The net change in the valuation allowance for deferred income tax assets was ($13,490), ($3,689), and ($21,851) during the years ended December 31, 2019, 2018, and 2017, respectively. A roll forward of our valuation allowance for deferred income tax assets for the years ended December 31, 2019, 2018, and 2017 is as follows:
| Balance at Beginning of Year | Charged to Costs and Expenses | Other Adjustments (a) | Balance at End of Year | |||||||||||||
| 2017 | $ | 67,662 | $ | 3,166 | $ | (25,017 | ) | $ | 45,811 | |||||||
| 2018 | $ | 45,811 | $ | (3,486 | ) | $ | (203 | ) | $ | 42,122 | ||||||
| 2019 | $ | 42,122 | $ | (13,473 | ) | $ | (17 | ) | $ | 28,632 | ||||||
66
CLARUS CORPORATION
NOTES TO CONSOLIDATED FINANCIAL STATEMENTS - CONTINUED
(in thousands, except per share amounts)
| (a) | During the year ended December 31, 2017, the decrease in valuation allowance is due to the Tax Act. |
As of December 31, 2019, the Company had net operating loss and research and experimentation credit for U.S. federal income tax purposes of $131,621 and $4,250, respectively. The Company believes its U.S. Federal net operating loss (“NOL”) will substantially offset its future U.S. Federal income taxes until expiration. The majority of the Company’s pre-tax income is currently earned and expected to be earned in the U.S., or taxed in the U.S. as Subpart F. income and will be offset with the NOL.
NOLs available to offset taxable income, subject to compliance with Section 382 of the Code, begin to expire based upon the following schedule:
| Net Operating Loss Carryforward Expiration Dates | ||||
| December 31, 2019 | ||||
| Expiration Dates December 31, | Net Operating Loss Amount | |||
| 2022 | $ | 111,049 | ||
| 2023 | 5,712 | |||
| 2024 | 3,566 | |||
| 2025 and beyond | 11,294 | |||
| Total | $ | 131,621 | ||
Tax positions are recognized in the financial statements when it is more-likely-than-not that the position will be sustained upon examination by the tax authorities. The Company conducts its business globally. As a result, the Company and its subsidiaries file income tax returns in the U.S. federal jurisdiction and various state and foreign jurisdictions, and are subject to examination for the open tax years in the U.S. federal and state jurisdictions of 2014-2018 and in the foreign jurisdictions of 2006-2018. The Company recognizes interest and penalties related to unrecognized tax benefits in income tax expense.
A reconciliation of the beginning and ending amount of total unrecognized tax benefits for the years ended December 31, 2019, 2018 and 2017 are follows:
| December 31, | ||||||||||||
| 2019 | 2018 | 2017 | ||||||||||
| Balance, beginning of year | $ | 545 | $ | 476 | $ | 1,135 | ||||||
| Additions for current year tax positions | 77 | 69 | 91 | |||||||||
| Additions for prior year tax positions | 11 | - | - | |||||||||
| Reductions for prior year tax positions | (72 | ) | - | (13 | ) | |||||||
| Payments in settlement | - | - | (737 | ) | ||||||||
| Balance, end of year | $ | 561 | $ | 545 | $ | 476 | ||||||
Included in the balance of total unrecognized tax benefits at December 31, 2019 and 2018, are potential benefits of $561 and $545, respectively, that if recognized, would affect the effective rate, subject to impact of valuation allowance, on income from continuing operations. Unrecognized tax benefits that reduce a net operating loss, similar tax loss or tax credit carryforward are presented as a reduction to deferred income taxes. As a result, the Company classified $462 and $384 of its unrecognized tax benefit as a reduction to deferred tax assets as of December 31, 2019 and 2018, respectively.
Interest and penalty expense recognized related to uncertain tax positions amounted to $0, $0, and $13 during the years ending December 31, 2019, 2018, and 2017, respectively. Total accrued interest and penalties as of December 31, 2019 and 2018 were $4 and $9, respectively, and were included in accounts payable and accrued liabilities.
67
CLARUS CORPORATION
NOTES TO CONSOLIDATED FINANCIAL STATEMENTS - CONTINUED
(in thousands, except per share amounts)
NOTE 15. SEGMENT INFORMATION
We operate our business structure within two segments. These segments are defined based on the internal financial reporting used by management. Certain significant selling and general and administrative expenses are not allocated to the segments including non-cash stock compensation expense. Each segment is described below:
| · | Our Black Diamond segment, which includes Black Diamond Equipment, PIEPS, and SKINourishment, is a global leader in designing, manufacturing, and marketing innovative outdoor engineered equipment and apparel for climbing, mountaineering, trail running, backpacking, skiing, and a wide range of other year-round outdoor recreation activities. Our Black Diamond segment offers a broad range of products including: high-performance, activity-based apparel (such as shells, insulation, midlayers, pants and logowear); rock-climbing footwear and equipment (such as carabiners, protection devices, harnesses, belay devices, helmets, and ice-climbing gear); technical backpacks and high-end day packs; trekking poles; headlamps and lanterns; gloves and mittens; and skincare and other sport-enhancing products. We also offer advanced skis, ski poles, ski skins, and snow safety products, including avalanche airbag systems, avalanche transceivers, shovels, and probes. |
| · | Our Sierra segment, which includes Sierra, is an iconic American manufacturer of a wide range of high-performance bullets and ammunition for both rifles and pistols. These bullets are used for precision target shooting, hunting and military and law enforcement purposes. |
As noted above, the Company has a wide variety of technical outdoor equipment and lifestyle products focused on the climb, ski, mountain and sport product categories that are sold to a variety of customers in multiple end markets. While there are multiple products sold, the terms and nature of revenue recognition policy is similar for all segments. The sport product category represents the Sierra segment revenue.
We divide our product offerings into four primary categories of climb, mountain, ski and sport. During the year ended December 31, 2019, revenue for the categories of climb, mountain, ski and sport was 31%, 34%, 22% and 13%, respectively. During the year ended December 31, 2018, revenue for the categories of climb, mountain, ski and sport was 30%, 34%, 19% and 17%, respectively.
Financial information for our segments is as follows:
| Year Ended December 31, | ||||||||||||
| 2019 | 2018 | 2017 | ||||||||||
| Sales to external customers: | ||||||||||||
| Black Diamond | ||||||||||||
| Domestic sales | $ | 100,294 | $ | 86,432 | $ | 81,166 | ||||||
| International sales | 99,652 | 90,314 | 79,165 | |||||||||
| Total Black Diamond | 199,946 | 176,746 | 160,331 | |||||||||
| Sierra | ||||||||||||
| Domestic sales | 21,457 | 26,105 | 7,437 | |||||||||
| International sales | 8,034 | 9,290 | 2,919 | |||||||||
| Total Sierra | 29,491 | 35,395 | 10,356 | |||||||||
| Total sales to external customers | 229,437 | 212,141 | 170,687 | |||||||||
| Segment operating income: | ||||||||||||
| Black Diamond | 15,553 | 11,102 | 4,215 | |||||||||
| Sierra | 4,008 | 5,808 | (344 | ) | ||||||||
| Total segment operating income | 19,561 | 16,910 | 3,871 | |||||||||
| Restructuring charge | (13 | ) | (137 | ) | (160 | ) | ||||||
| Merger and integration | - | - | (82 | ) | ||||||||
| Transaction costs | (166 | ) | (503 | ) | (2,088 | ) | ||||||
| Corporate and other expenses | (8,043 | ) | (8,458 | ) | (6,013 | ) | ||||||
| Interest expense, net | (1,358 | ) | (1,339 | ) | (1,288 | ) | ||||||
| Income (loss) before income tax | $ | 9,981 | $ | 6,473 | $ | (5,760 | ) | |||||
68
There were no intercompany sales between the Black Diamond and Sierra segments for the periods presented. Restructuring charges for the periods presented relate to the Black Diamond segment.
Total assets by segment, as of December 31, 2019 and 2018, were as follows:
| December 31, | ||||||||
| 2019 | 2018 | |||||||
| Black Diamond | $ | 147,261 | $ | 138,029 | ||||
| Sierra | 72,104 | 72,796 | ||||||
| Corporate | 10,900 | 2,303 | ||||||
| $ | 230,265 | $ | 213,128 | |||||
Capital expenditures, depreciation and amortization by segment is as follows.
| Year Ended December 31, | ||||||||||||
| 2019 | 2018 | 2017 | ||||||||||
| Capital expenditures: | ||||||||||||
| Black Diamond | $ | 2,636 | $ | 2,560 | $ | 2,699 | ||||||
| Sierra | 1,480 | 805 | 148 | |||||||||
| Total capital expenditures | $ | 4,116 | $ | 3,365 | $ | 2,847 | ||||||
| Depreciation: | ||||||||||||
| Black Diamond | $ | 2,645 | $ | 2,469 | $ | 2,254 | ||||||
| Sierra | 1,905 | 1,954 | 629 | |||||||||
| Total depreciation | $ | 4,550 | $ | 4,423 | $ | 2,883 | ||||||
| Amortization: | ||||||||||||
| Black Diamond | $ | 1,111 | $ | 1,099 | $ | 1,081 | ||||||
| Sierra | 2,441 | 2,774 | 1,295 | |||||||||
| Total amortization | $ | 3,552 | $ | 3,873 | $ | 2,376 | ||||||
NOTE 16. LEASES
The Company has entered into leases for certain facilities, vehicles and other equipment. Our operating leases have remaining contractual terms of up to six years, some of which include options to extend the leases for up to five years. Our operating lease costs are primarily related to facility leases for inventory warehousing, administration offices and vehicles. The Company’s finance leases are immaterial.
Operating lease ROU assets and liabilities as of December 31, 2019 are as follows:
| Balance Sheet Classification | December 31, 2019 | |||||
| Assets | ||||||
| Operating lease ROU assets | Other long-term assets | $ | 1,200 | |||
| Liabilities | ||||||
| Current operating lease liabilities | Accounts payable and accrued liabilities | $ | 681 | |||
| Noncurrent operating lease liabilities | Other long-term liabilities | $ | 500 | |||
69
CLARUS CORPORATION
NOTES TO CONSOLIDATED FINANCIAL STATEMENTS - CONTINUED
(in thousands, except per share amounts)
Operating lease costs are as follows:
| Affected line item in the
Consolidated Statements of Comprehensive Income | Year Ended December 31, 2019 | |||||
| Lease costs | Cost of goods sold, Selling, general and administrative | $ | 750 | |||
| Variable lease costs | Cost of goods sold, Selling, general and administrative | 208 | ||||
| Short-term lease costs | Cost of goods sold, Selling, general and administrative | 228 | ||||
| $ | 1,186 | |||||
The maturity of operating lease liabilities as of December 31, 2019 are as follows:
| Years Ending December 31, | Operating Lease Payments | |||
| 2020 | $ | 732 | ||
| 2021 | 344 | |||
| 2022 | 88 | |||
| 2023 | 28 | |||
| 2024 and thereafter | 38 | |||
| Total future lease payments | 1,230 | |||
| Less: amount representing interest | (49 | ) | ||
| Present value of future lease payments | 1,181 | |||
| Less: current lease obligations | (681 | ) | ||
| Long-term lease obligations | $ | 500 | ||
As of December 31, 2019, our operating leases have a weighted-average remaining lease term of 2.0 years and a weighted-average discount rate of 3.97%. Total rent expense of the Company for the years ended December 31, 2018 and 2017 was $838 and $865, respectively, as determined prior to the adoption of ASC 842. Future minimum lease payments required under noncancelable operating leases that have initial or remaining noncancelable lease term in excess of one year at December 31, 2018 as determined prior to the adoption of ASC 842 are as follows:
| Years Ending December 31, | Future Minimum Lease Payments | |||
| 2019 | $ | 687 | ||
| 2020 | 634 | |||
| 2021 | 243 | |||
| 2022 | 24 | |||
| 2023 | - | |||
| Thereafter | - | |||
| $ | 1,588 | |||
NOTE 17. RELATED PARTY TRANSACTIONS
5% Unsecured Subordinated Notes due May 28, 2017
As part of the consideration payable to the stockholders of a formerly acquired entity, the Company issued 5% Unsecured Subordinated Notes due May 28, 2017 (the “Merger Consideration Subordinated Notes”) to members of the Board of Directors and five former employees. Given the below market interest rate for comparably secured notes and the relative illiquidity of the Merger Consideration Subordinated Notes, we discounted the notes at the date of acquisition. We were accreting the discount on the Merger Consideration Subordinated Notes to interest expense using the effective interest method over the term of the Merger Consideration Subordinated Notes. In February 2017, the Board of Directors approved the repayment of the Merger Consideration Subordinated Notes. On February 13, 2017, the entire principal amount and all accrued interest were paid in full. The note discount of $814 was expensed and recognized as interest expense during the year ended December 31, 2017.
Upon the Company’s acquisition of Sierra, on August 21, 2017, the Company paid a fee in the amount of $1,000 to Kanders & Company, Inc. (“Kanders & Company”), which is included in transaction costs, in consideration of the significant support received by the Company from Kanders & Company in sourcing, structuring, performing due diligence and negotiating the acquisition. Mr. Warren B. Kanders, the Company’s Executive Chairman of the Board of Directors and a member of its Board of Directors, is the sole stockholder of Kanders & Company.
70
CLARUS CORPORATION
NOTES TO CONSOLIDATED FINANCIAL STATEMENTS - CONTINUED
(in thousands, except per share amounts)
SUPPLEMENTARY DATA – QUARTERLY FINANCIAL DATA (Unaudited)
The following table sets forth selected quarterly data for the years ended December 31, 2019 and 2018. The operating results are not indicative of results for any future period.
| Year Ended December 31, 2019 | ||||||||||||||||
| First Quarter | Second Quarter | Third Quarter | Fourth Quarter | |||||||||||||
| (in thousands, except per share amounts) | ||||||||||||||||
| Net sales | $ | 61,218 | $ | 46,994 | $ | 60,203 | $ | 61,022 | ||||||||
| Gross profit | 22,056 | 15,992 | 20,557 | 21,686 | ||||||||||||
| Operating income (loss) | 4,417 | (1,241 | ) | 4,077 | 4,179 | |||||||||||
| Net income (loss) | 3,787 | (694 | ) | 3,492 | 12,387 | |||||||||||
| Net income (loss) per share: | ||||||||||||||||
| Basic | $ | 0.13 | $ | (0.02 | ) | $ | 0.12 | $ | 0.42 | |||||||
| Diluted | 0.12 | (0.02 | ) | 0.11 | 0.40 | |||||||||||
| Year Ended December 31, 2018 | ||||||||||||||||
| First Quarter | Second Quarter | Third Quarter | Fourth Quarter | |||||||||||||
| (in thousands, except per share amounts) | ||||||||||||||||
| Net sales | $ | 53,267 | $ | 45,881 | $ | 55,686 | $ | 57,307 | ||||||||
| Gross profit | 17,827 | 15,860 | 19,857 | 20,418 | ||||||||||||
| Operating income (loss) | 494 | (123 | ) | 4,012 | 3,788 | |||||||||||
| Net income (loss) | 403 | (777 | ) | 4,127 | 3,548 | |||||||||||
| Net income (loss) per share: | ||||||||||||||||
| Basic | $ | 0.01 | $ | (0.03 | ) | $ | 0.14 | $ | 0.12 | |||||||
| Diluted | 0.01 | (0.03 | ) | 0.14 | 0.12 | |||||||||||
71
CLARUS CORPORATION
ITEM 9. CHANGES IN AND DISAGREEMENTS WITH ACCOUNTANTS ON ACCOUNTING AND FINANCIAL DISCLOSURE
None.
ITEM 9A. CONTROLS AND PROCEDURES
Evaluation of Disclosure Controls and Procedures
The Company’s management carried out an evaluation, under the supervision and with the participation of the Company’s Executive Chairman and Chief Financial Officer, its principal executive officer and principal financial officer, respectively, of the effectiveness of the design and operation of the Company’s disclosure controls and procedures (as such term is defined in Rules 13a-15(e) and 15d-15(e) under the Exchange Act) as of December 31, 2019, pursuant to Exchange Act Rule 13a-15. Such disclosure controls and procedures are designed to ensure that information required to be disclosed by the Company is accumulated and communicated to the appropriate management on a basis that permits timely decisions regarding disclosure. Based upon that evaluation, the Company’s Executive Chairman and Chief Financial Officer concluded that the Company’s disclosure controls and procedures as of December 31, 2019, were effective.
Management’s Report on Internal Control Over Financial Reporting
Management of the Company is responsible for establishing and maintaining adequate internal control over financial reporting as defined in Rules 13a-15(f) and 15d-15(f) under the Exchange Act. The Company’s internal control over financial reporting is designed to provide reasonable assurance regarding the reliability of financial reporting and the preparation of financial statements for external purposes in accordance with accounting principles generally accepted in the United States of America (“US GAAP”). The Company’s internal control over financial reporting includes those policies and procedures that:
| · | pertain to the maintenance of records that, in reasonable detail, accurately and fairly reflect the transactions and dispositions of the assets of the Company; | |
| · | provide reasonable assurance that transactions are recorded as necessary to permit preparation of financial statements in accordance with US GAAP, and that receipts and expenditures of the Company are being made only in accordance with authorizations of management and directors of the Company; and | |
| · | provide reasonable assurance regarding prevention or timely detection of unauthorized acquisition, use or disposition of the Company’s assets that could have a material effect on the financial statements. |
Because of its inherent limitations, internal control over financial reporting may not prevent or detect misstatements. Also, projections of any evaluation of effectiveness to future periods are subject to the risk that controls may become inadequate because of changes in conditions, or that the degree of compliance with the policies or procedures may deteriorate.
As required by Section 404 of the Sarbanes-Oxley Act of 2002, management assessed the effectiveness of the Company’s internal control over financial reporting as of December 31, 2019. In making this assessment, management used the criteria set forth by the Committee of Sponsoring Organizations of the Treadway Commission (“COSO”) in Internal Control-Integrated Framework (2013).
Based on our assessment and those criteria, management concluded that the Company maintained effective internal control over financial reporting as of December 31, 2019. The Company’s independent registered public accounting firm, Deloitte & Touche LLP, has issued an audit report on the Company’s internal control over financial reporting, which is included herein.
Changes in Internal Control Over Financial Reporting
There has been no change in our internal control over financial reporting that occurred during our fiscal quarter ended December 31, 2019, that has materially affected, or is reasonably likely to materially affect, our internal control over financial reporting.
72
CLARUS CORPORATION
Report of Independent Registered Public Accounting Firm
To the Stockholders and the Board of Directors of Clarus Corporation
Opinion on Internal Control over Financial Reporting
We have audited the internal control over financial reporting of Clarus Corporation and subsidiaries (the “Company”) as of December 31, 2019, based on criteria established in Internal Control — Integrated Framework (2013) issued by the Committee of Sponsoring Organizations of the Treadway Commission (COSO). In our opinion, the Company maintained, in all material respects, effective internal control over financial reporting as of December 31, 2019, based on criteria established in Internal Control — Integrated Framework (2013) issued by COSO.
We have also audited, in accordance with the standards of the Public Company Accounting Oversight Board (United States) (PCAOB), the consolidated financial statements as of and for the year ended December 31, 2019, of the Company and our report dated March 9, 2020, expressed an unqualified opinion on those financial statements.
Basis for Opinion
The Company’s management is responsible for maintaining effective internal control over financial reporting and for its assessment of the effectiveness of internal control over financial reporting, included in the accompanying Management's Report on Internal Control over Financial Reporting. Our responsibility is to express an opinion on the Company’s internal control over financial reporting based on our audit. We are a public accounting firm registered with the PCAOB and are required to be independent with respect to the Company in accordance with the U.S. federal securities laws and the applicable rules and regulations of the Securities and Exchange Commission and the PCAOB.
We conducted our audit in accordance with the standards of the PCAOB. Those standards require that we plan and perform the audit to obtain reasonable assurance about whether effective internal control over financial reporting was maintained in all material respects. Our audit included obtaining an understanding of internal control over financial reporting, assessing the risk that a material weakness exists, testing and evaluating the design and operating effectiveness of internal control based on the assessed risk, and performing such other procedures as we considered necessary in the circumstances. We believe that our audit provides a reasonable basis for our opinion.
Definition and Limitations of Internal Control over Financial Reporting
A company’s internal control over financial reporting is a process designed to provide reasonable assurance regarding the reliability of financial reporting and the preparation of financial statements for external purposes in accordance with generally accepted accounting principles. A company’s internal control over financial reporting includes those policies and procedures that (1) pertain to the maintenance of records that, in reasonable detail, accurately and fairly reflect the transactions and dispositions of the assets of the company; (2) provide reasonable assurance that transactions are recorded as necessary to permit preparation of financial statements in accordance with generally accepted accounting principles, and that receipts and expenditures of the company are being made only in accordance with authorizations of management and directors of the company; and (3) provide reasonable assurance regarding prevention or timely detection of unauthorized acquisition, use, or disposition of the company’s assets that could have a material effect on the financial statements.
Because of its inherent limitations, internal control over financial reporting may not prevent or detect misstatements. Also, projections of any evaluation of effectiveness to future periods are subject to the risk that controls may become inadequate because of changes in conditions, or that the degree of compliance with the policies or procedures may deteriorate.
/s/ Deloitte & Touche LLP
Salt Lake City, Utah
March 9, 2020
73
CLARUS CORPORATION
None.
ITEM 10. DIRECTORS, EXECUTIVE OFFICERS AND CORPORATE GOVERNANCE
Information regarding executive officers is included in Part I of this Annual Report on Form 10-K as permitted by General Instruction G(3).
The Company has adopted a code of ethics that applies to its principal executive officer and principal financial officer, and to all of its other officers, directors and employees. The code of business conduct and ethics may be accessed at www.claruscorp.com, our Internet website, at the tab “Governance” under the section called “Governance Documents.” The Company intends to disclose future amendments to, or waivers from, certain provisions of its code of business conduct and ethics, if any, on the above website within five business days following the date of such amendment or waiver.
Other information required by Item 10, including information regarding directors, membership and function of the audit committee, including the financial expertise of its members, and Section 16(a) compliance, appearing under the captions “Election of Directors”, “Information Regarding Board of Directors and Committees” and “Other Matters” in our Proxy Statement used in connection with our 2020 Annual Meeting of Stockholders, is incorporated herein by reference. The Company intends to file its Proxy Statement with the Securities Exchange Commission (the “SEC”) not later than 120 days after December 31, 2019.
ITEM 11. EXECUTIVE COMPENSATION
The information set forth under the caption “Executive Compensation” in our Proxy Statement used in connection with our 2020 Annual Meeting of Stockholders, is incorporated herein by reference. The Company intends to file its Proxy Statement with the SEC not later than 120 days after December 31, 2019.
ITEM 12. SECURITY OWNERSHIP OF CERTAIN BENEFICIAL OWNERS AND MANAGEMENT AND RELATED STOCKHOLDER MATTERS
The information set forth under the caption “Security Ownership of Certain Beneficial Owners and Management and Related Stockholder Matters” in our Proxy Statement used in connection with our 2020 Annual Meeting of Stockholders, is incorporated herein by reference. The Company intends to file its Proxy Statement with the SEC not later than 120 days after December 31, 2019.
ITEM 13. CERTAIN RELATIONSHIPS AND RELATED TRANSACTIONS, AND DIRECTOR INDEPENDENCE
The information set forth under the caption “Certain Relationships and Related Transactions, and Director Independence” in our Proxy Statement used in connection with our 2020 Annual Meeting of Stockholders, is incorporated herein by reference. The Company intends to file its Proxy Statement with the SEC not later than 120 days after December 31, 2019.
ITEM 14. PRINCIPAL ACCOUNTANT FEES AND SERVICES
The information set forth under the caption “Principal Accountant Fees and Services” in our Proxy Statement used in connection with our 2020 Annual Meeting of Stockholders, is incorporated herein by reference. The Company intends to file its Proxy Statement with the SEC not later than 120 days after December 31, 2019.
74
CLARUS CORPORATION
ITEM 15. EXHIBITS AND FINANCIAL STATEMENT SCHEDULES
Financial Statements, Financial Statement Schedules and Exhibits
(a)(1) The Financial Statements. The Financial Statements of the Company are included in Item 8 above.
(a)(2) Financial Statement Schedules. No schedules are included because the required information is inapplicable, not required or are presented in the financial statements or the related notes thereto.
(a)(3) The following Exhibits are hereby filed as part of this Annual Report on Form 10-K:
75
CLARUS CORPORATION
76
CLARUS CORPORATION
77
CLARUS CORPORATION
Pursuant to the requirements of Section 13 or 15(d) of the Securities Exchange Act of 1934, the Company has duly caused this report to be signed on its behalf by the undersigned, thereunto duly authorized.
| CLARUS CORPORATION | ||
| Date: March 9, 2020 | ||
| By: | /s/ Aaron J. Kuehne | |
| Aaron J. Kuehne, | ||
| Chief Administrative Officer and | ||
| Chief Financial Officer | ||
| (Principal Financial Officer and Principal Accounting Officer) | ||
| Name | Title | |
| /s/ Warren B. Kanders | Executive Chairman and Director (Principal Executive Officer) | |
| Warren B. Kanders | ||
| /s/ Aaron J. Kuehne | Chief Administrative Officer and Chief Financial Officer (Principal Financial Officer and Principal Accounting Officer) | |
| Aaron J. Kuehne | ||
| /s/ Donald L. House | Director | |
| Donald L. House | ||
| /s/ Nicholas Sokolow | Director | |
| Nicholas Sokolow | ||
| /s/ Michael A. Henning | Director | |
| Michael A. Henning |
78