|

| 6 February 2023 |
|

| 6 February 2023 ▪ ▪ ▪ ▪ ▪ ▪ ▪ |
| 6 February 2023 ▪ ▪ ▪ ▪ ▪ ▪ ▪ ▪ |
| 6 February 2023 |

|

|

| 6 February 2023 We help people make space for adventure with world ready outdoor gear born and proven in Australia. .. |

| THIS IS OUR LAB |
| THIS IS OUR QUALITY CONTROL |

| AND THIS IS OUR FIELD TEST |

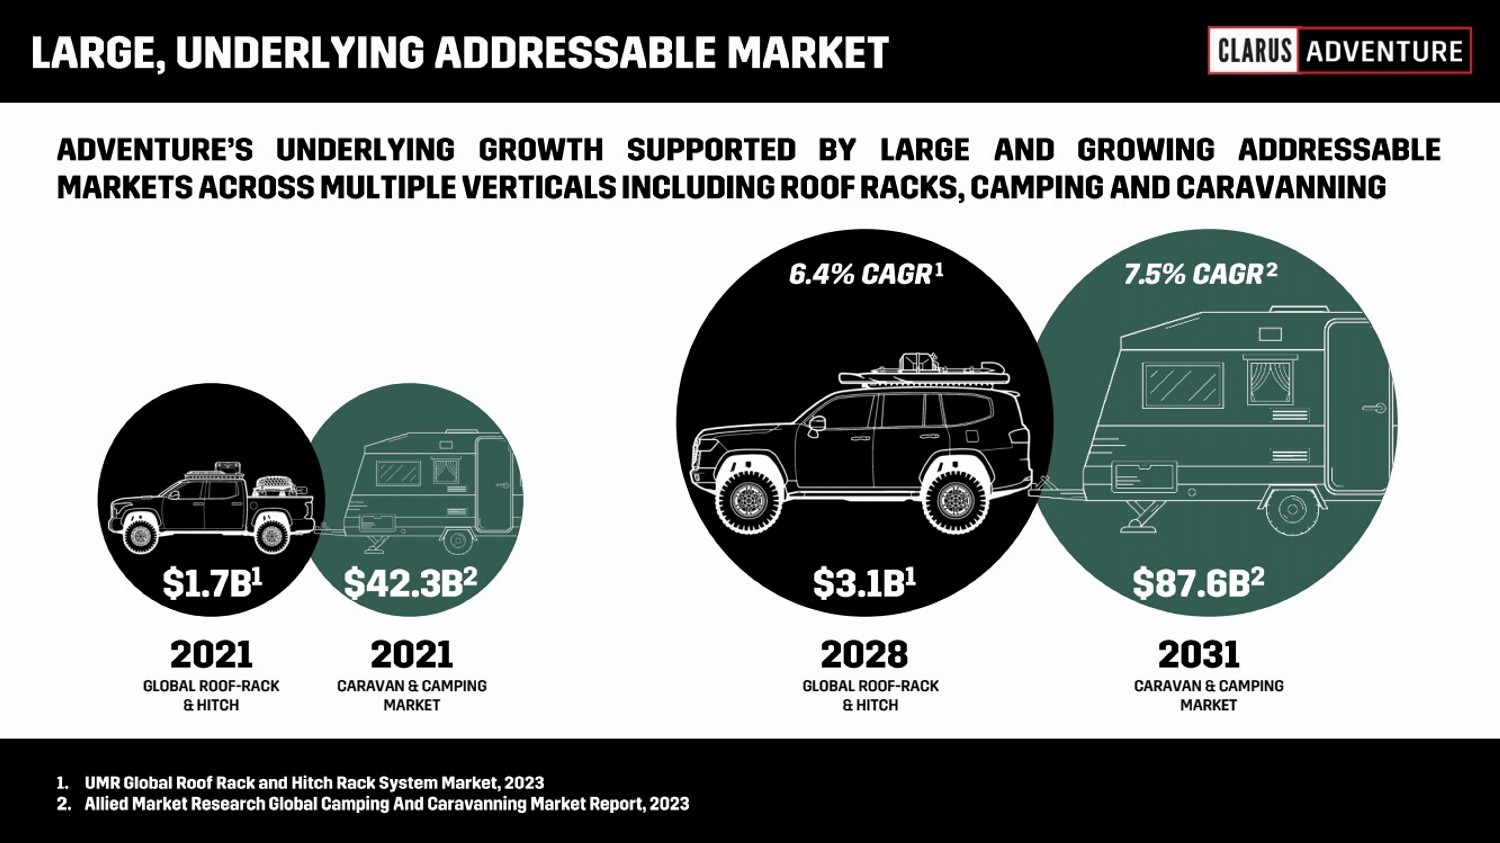
| GLOBAL ROOF -RACK & HITCH CARAVAN & CAMPING MARKET GLOBAL ROOF -RACK & HITCH CARAVAN & CAMPING MARKET |
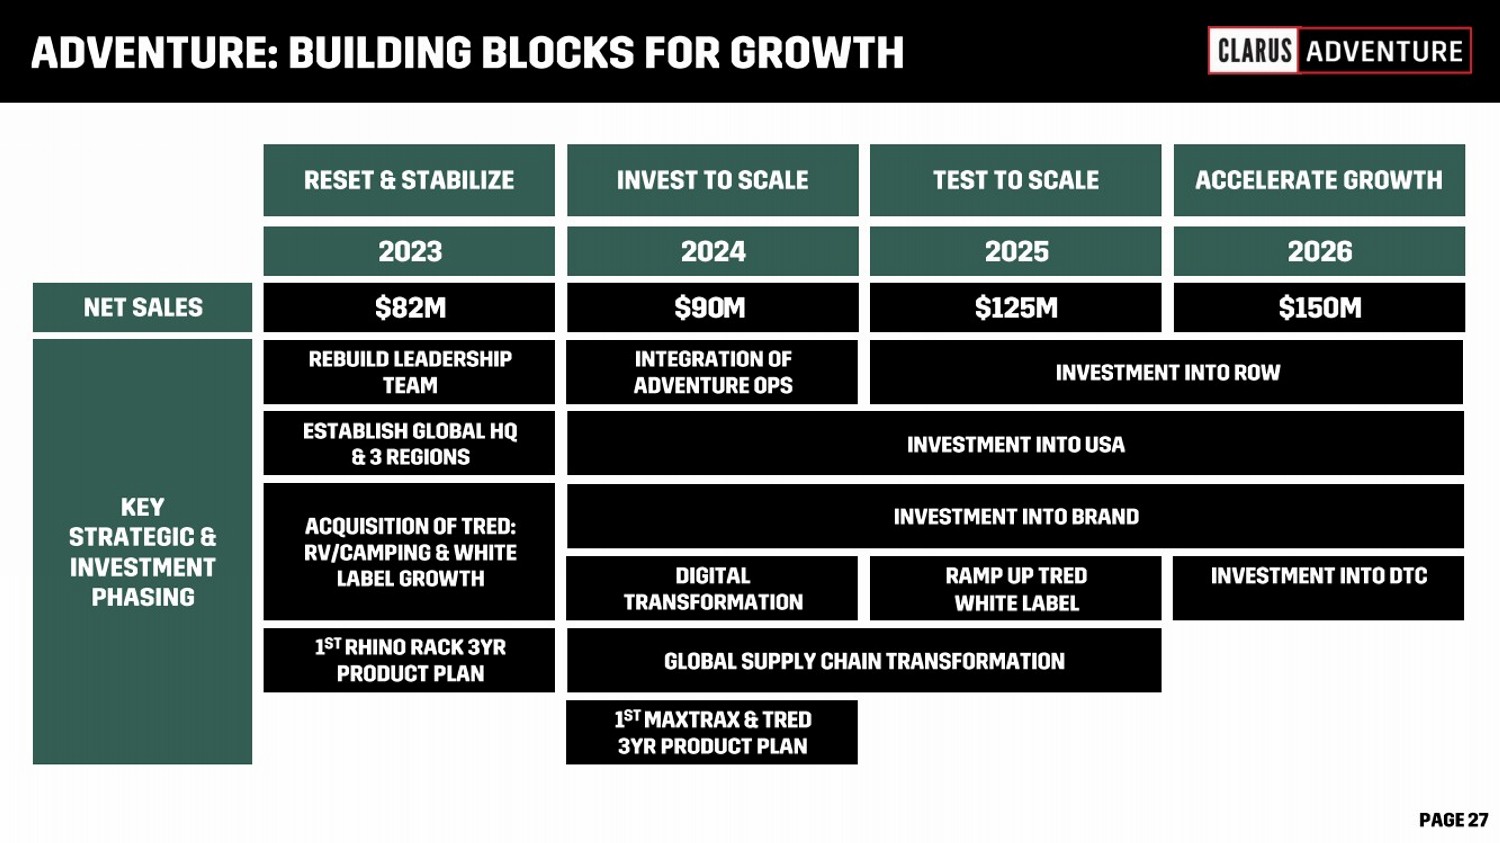
| FY24F Revenue FY24F EBITDA # Retail Doors Worldwide # Countries Distributed to # Employee’s Worldwide |

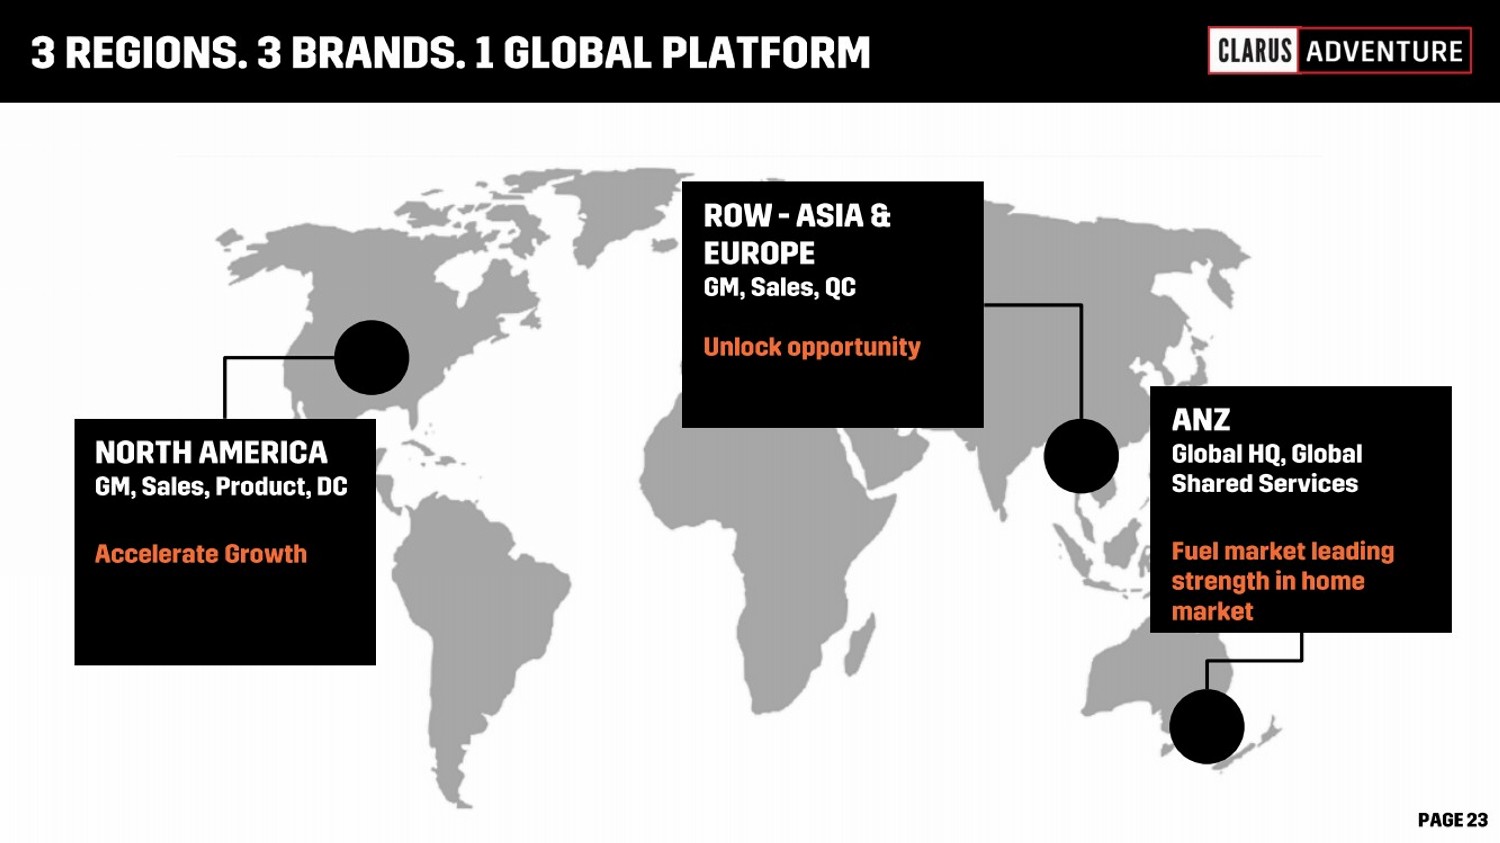
| 6 February 2023 ANZ, 65% Americas, 25% ROW, 10% Wholesale, 75% DTC, 15% OEM, 10% Trays, 20% Bars, 30% Accessories, 50% |

| 6 February 2023 OVERLANDING CAMPING CYCLING TOURING WATER SPORTS WEEKEND ADVENTURE SNOW TRADE |

| 6 February 2023 |

| 6 February 2023 SNOW OVERLANDING CAMPING CYCLING TOURING WATER SPORTS WEEKEND ADVENTURE TRADE |

| 6 February 2023 |

| 6 February 2023 |
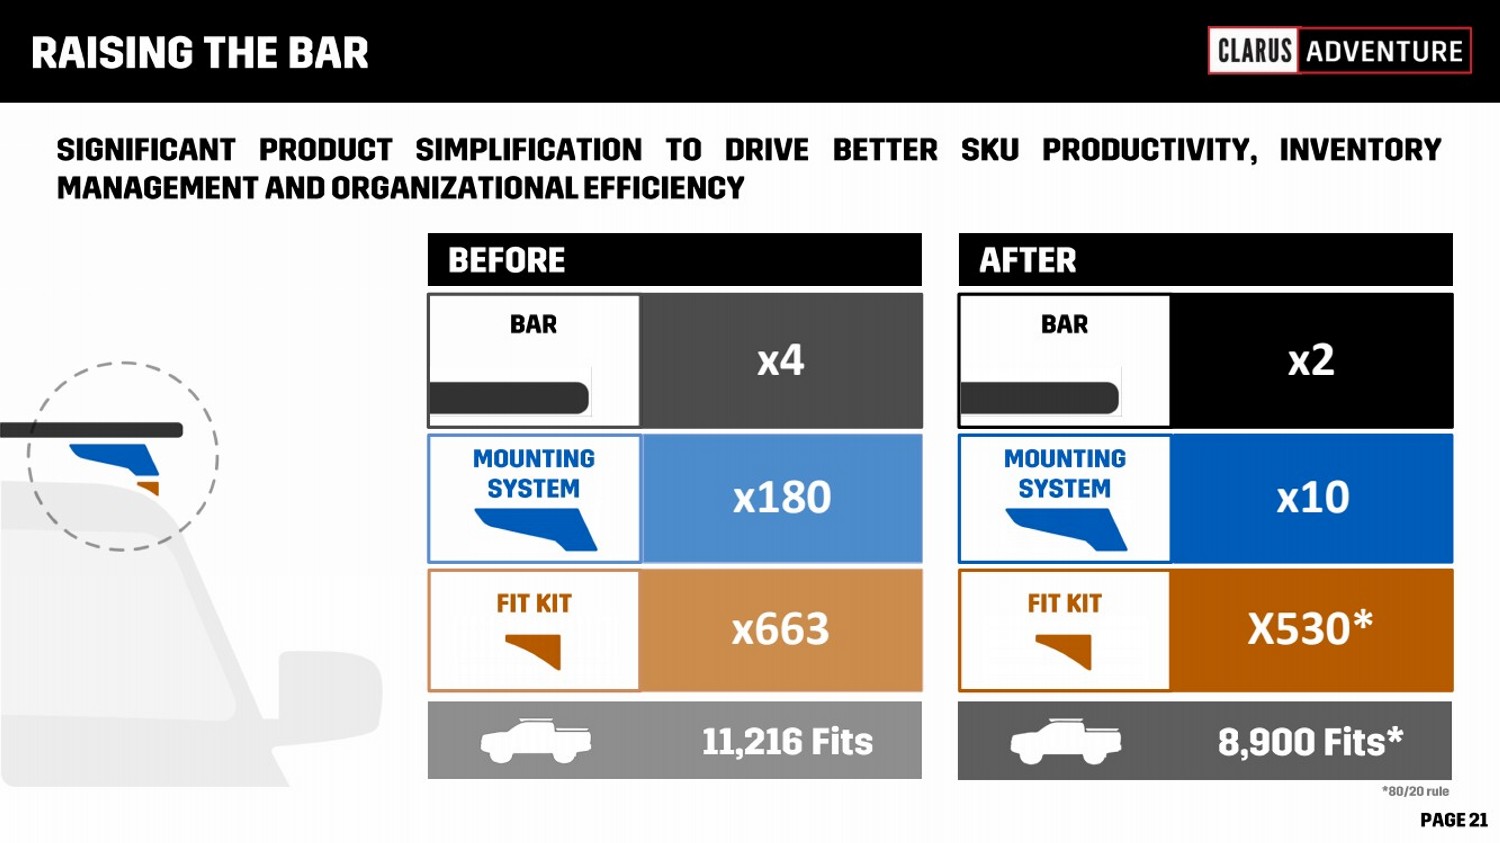
| 6 February 2023 x663 x180 x4 X530* x10 x2 |
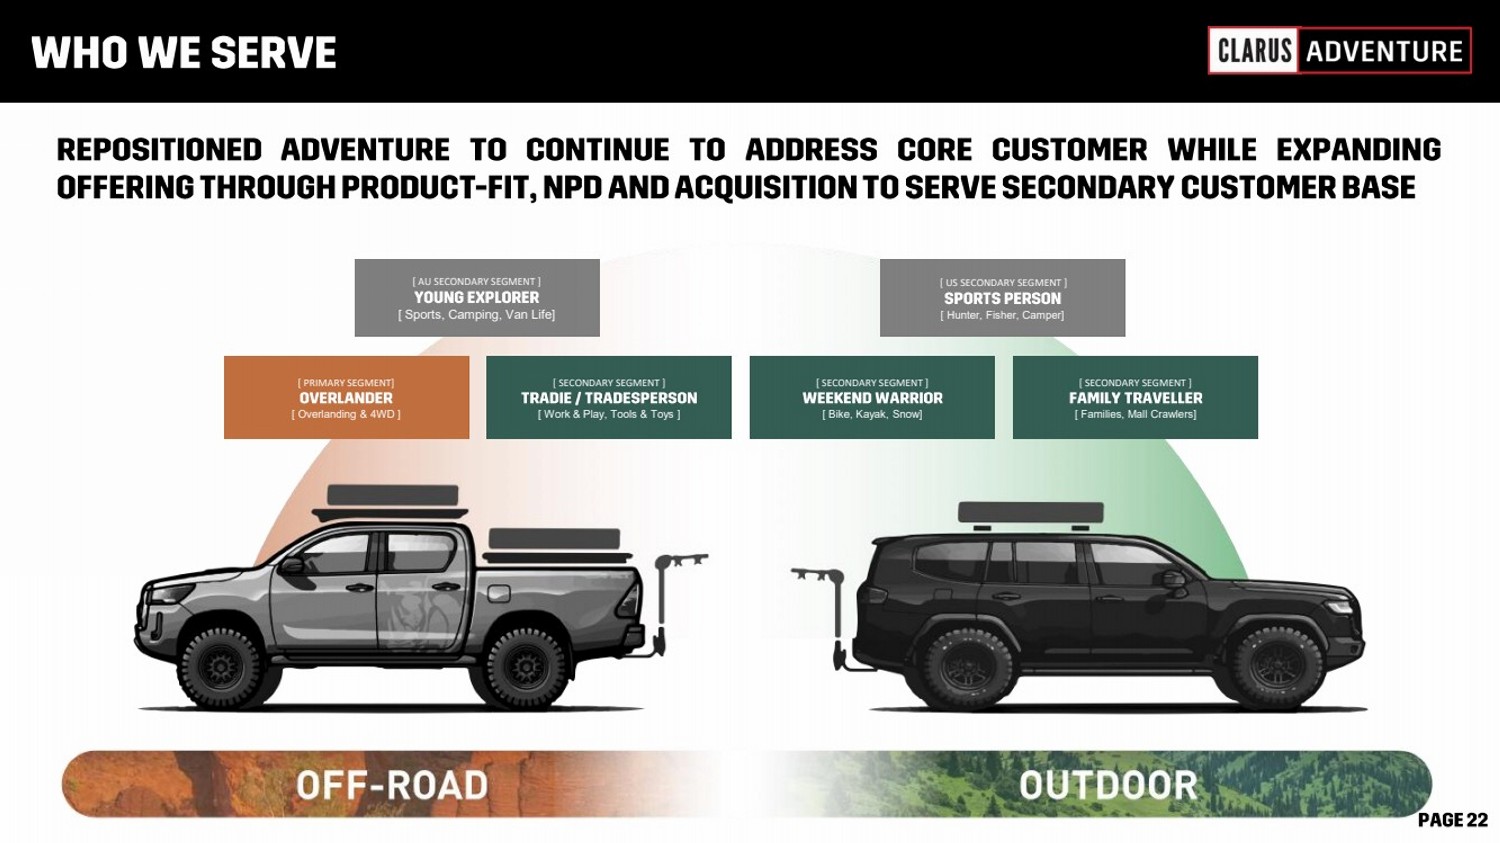
| 6 February 2023 [ PRIMARY SEGMENT] [ Overlanding & 4WD ] [ SECONDARY SEGMENT ] [ Work & Play, Tools & Toys ] [ SECONDARY SEGMENT ] [ Bike, Kayak, Snow] [ SECONDARY SEGMENT ] [ Families, Mall Crawlers] [ AU SECONDARY SEGMENT ] [ Sports, Camping, Van Life] [ US SECONDARY SEGMENT ] [ Hunter, Fisher, Camper] |
| 6 February 2023 |
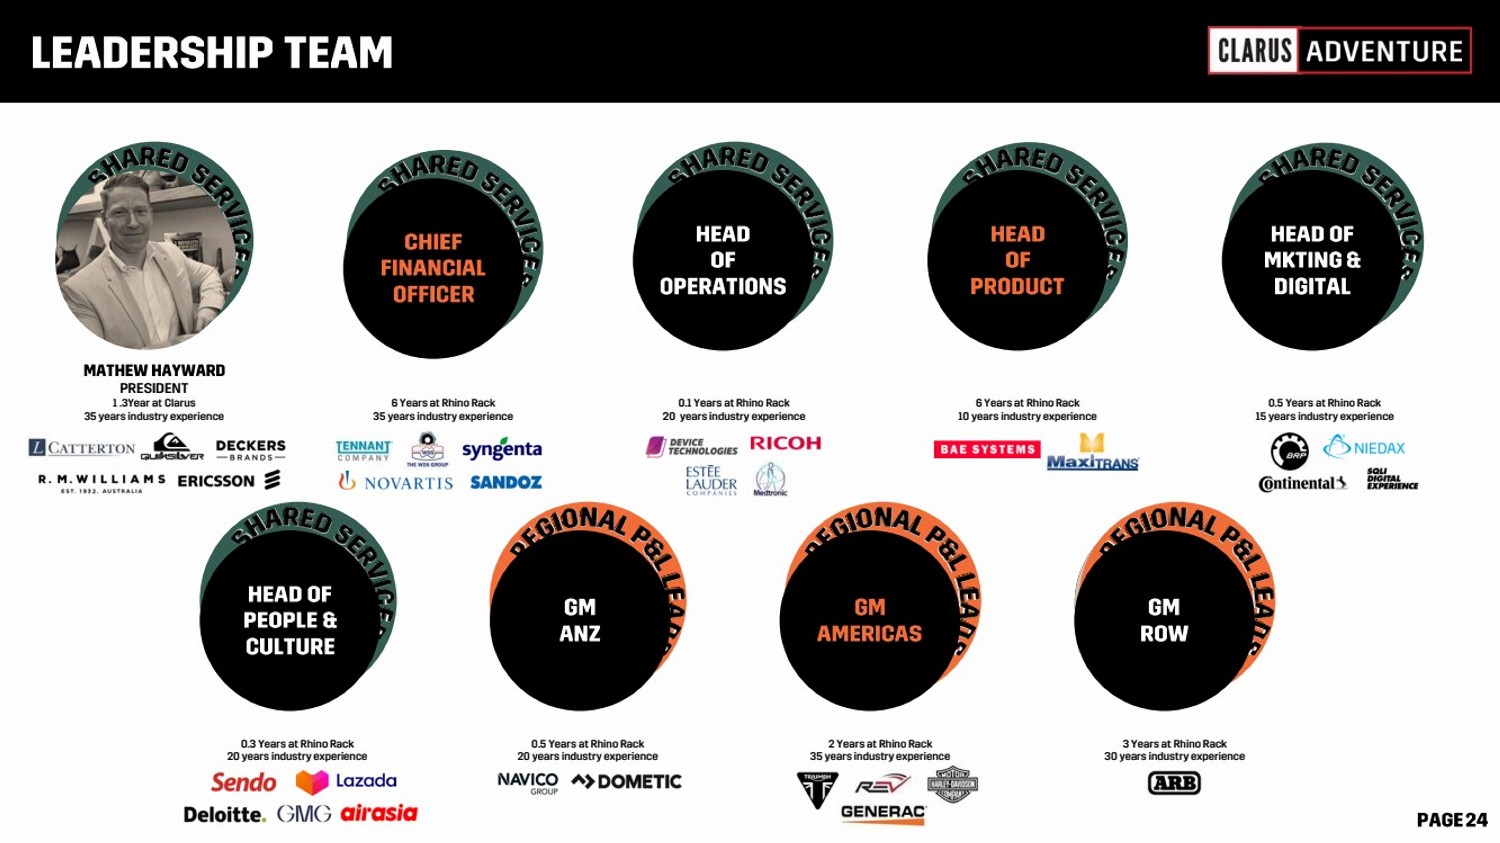
| 6 February 2023 PRESIDENT 1 .3Year at Clarus 35 years industry experience Chief Finance Officer 6 Years at Rhino Rack 35 years industry experience Head of Operations 0.1 Years at Rhino Rack 20 years industry experience Head of Product 6 Years at Rhino Rack 10 years industry experience Head of Marketing & Digital 0.5 Years at Rhino Rack 15 years industry experience Head of People & Culture 0.3 Years at Rhino Rack 20 years industry experience GM ANZ 0.5 Years at Rhino Rack 20 years industry experience GM AMERICAS 2 Years at Rhino Rack 35 years industry experience GM Rest of World 3 Years at Rhino Rack 30 years industry experience |
| 6 February 2023 |
| 6 February 2023 ••••• ••• ••• •••• |
| 6 February 2023 |
| 6 February 2023 |

| 6 February 2023 |

| OUTDOOR |

|

| 6 February 2023 Iconic founder driven brand W e h e l p p e o p l e m a k e s p a c e f o r a d v e n t u r e w i t h w o r l d r e a d y o u t d o o r g e a r b o r n a n d p r o v e n i n A u s t r a l i a . |

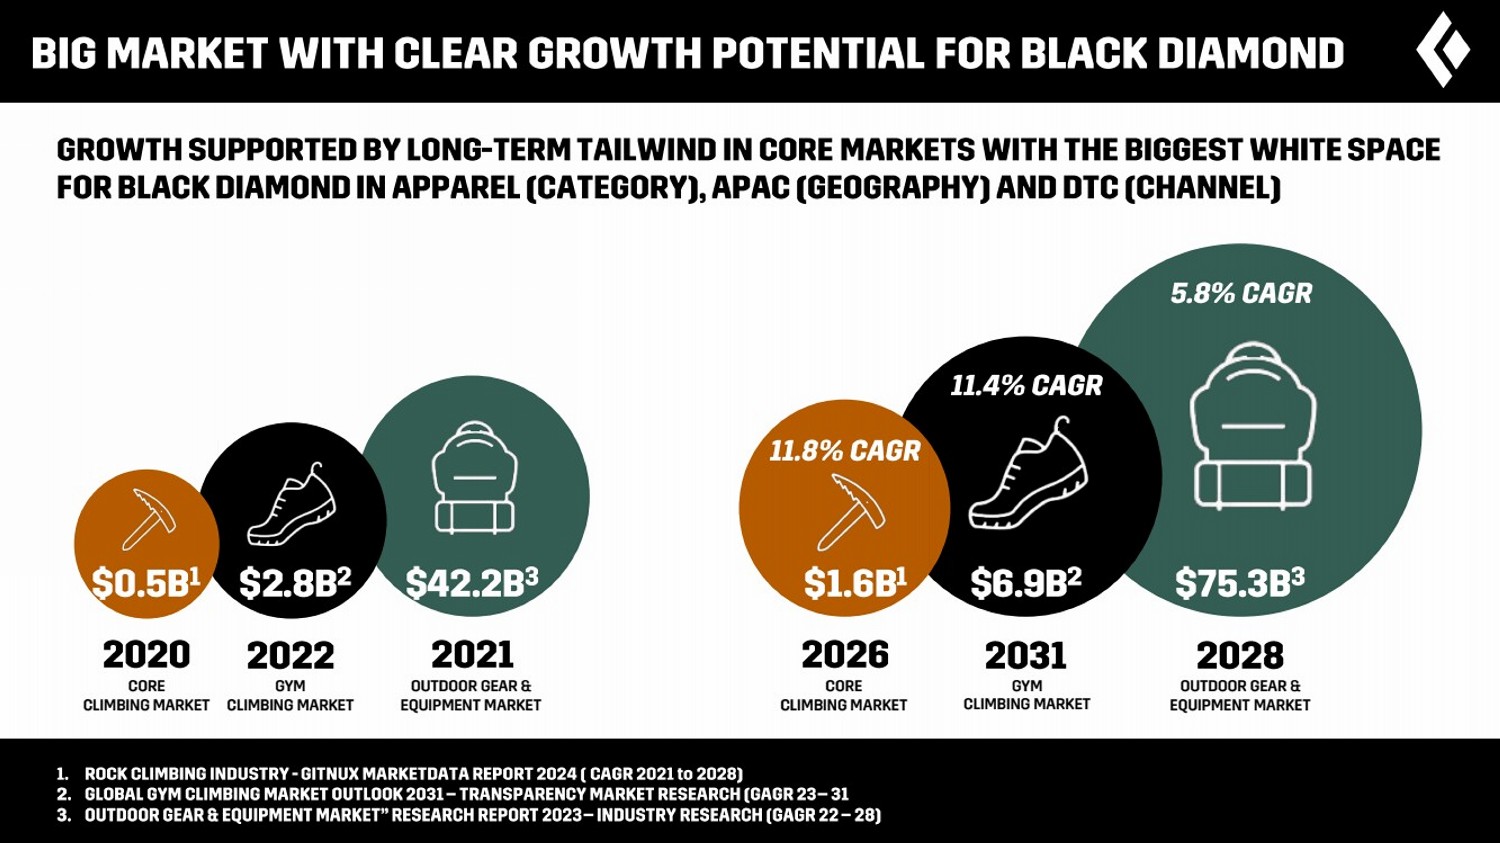
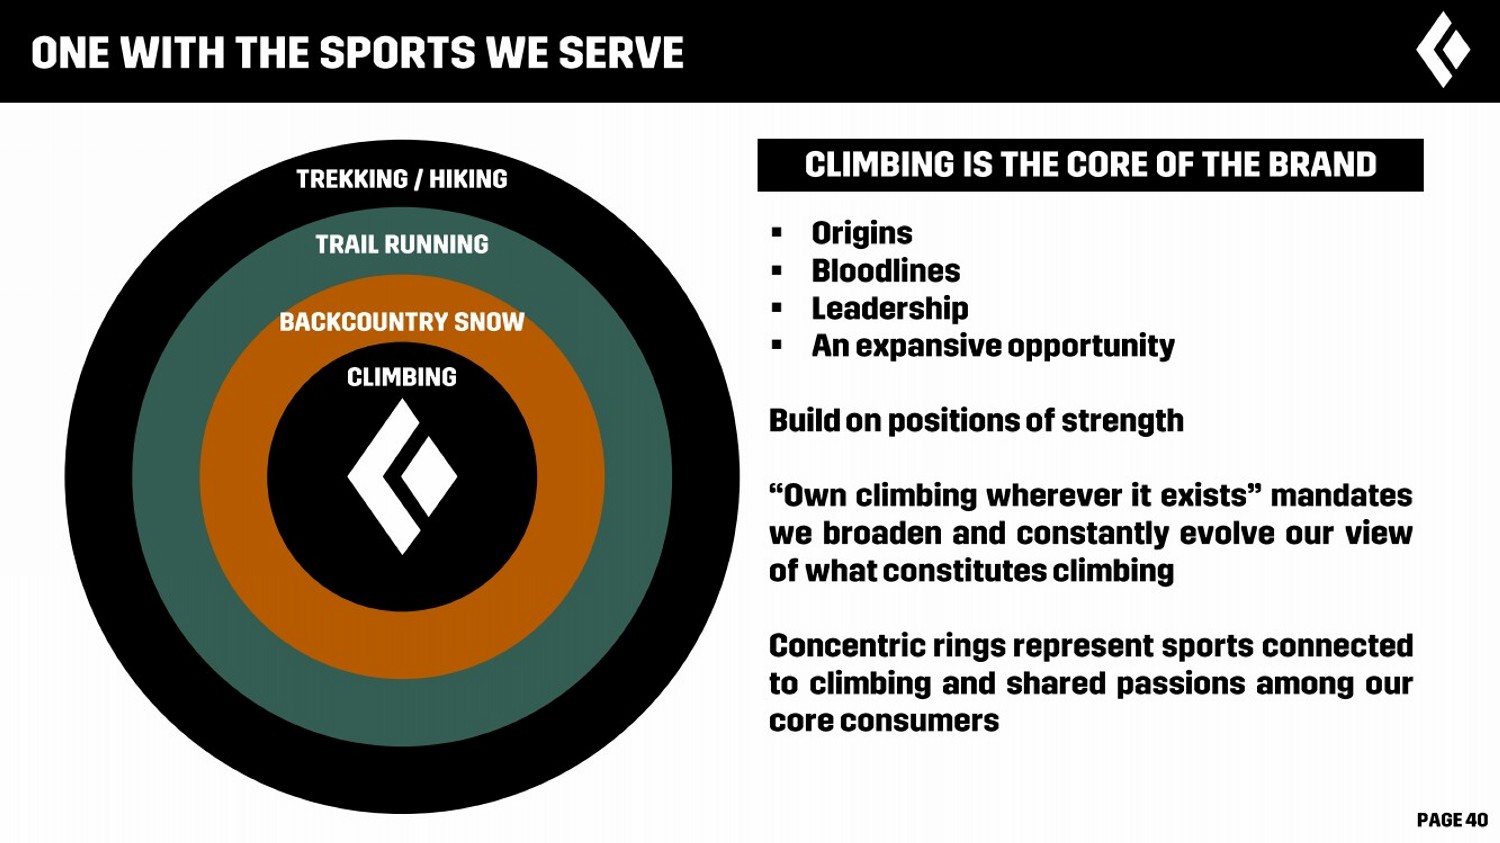
| CORE CLIMBING MARKET OUTDOOR GEAR & EQUIPMENT MARKET GYM CLIMBING MARKET CORE CLIMBING MARKET OUTDOOR GEAR & EQUIPMENT MARKET GYM CLIMBING MARKET |
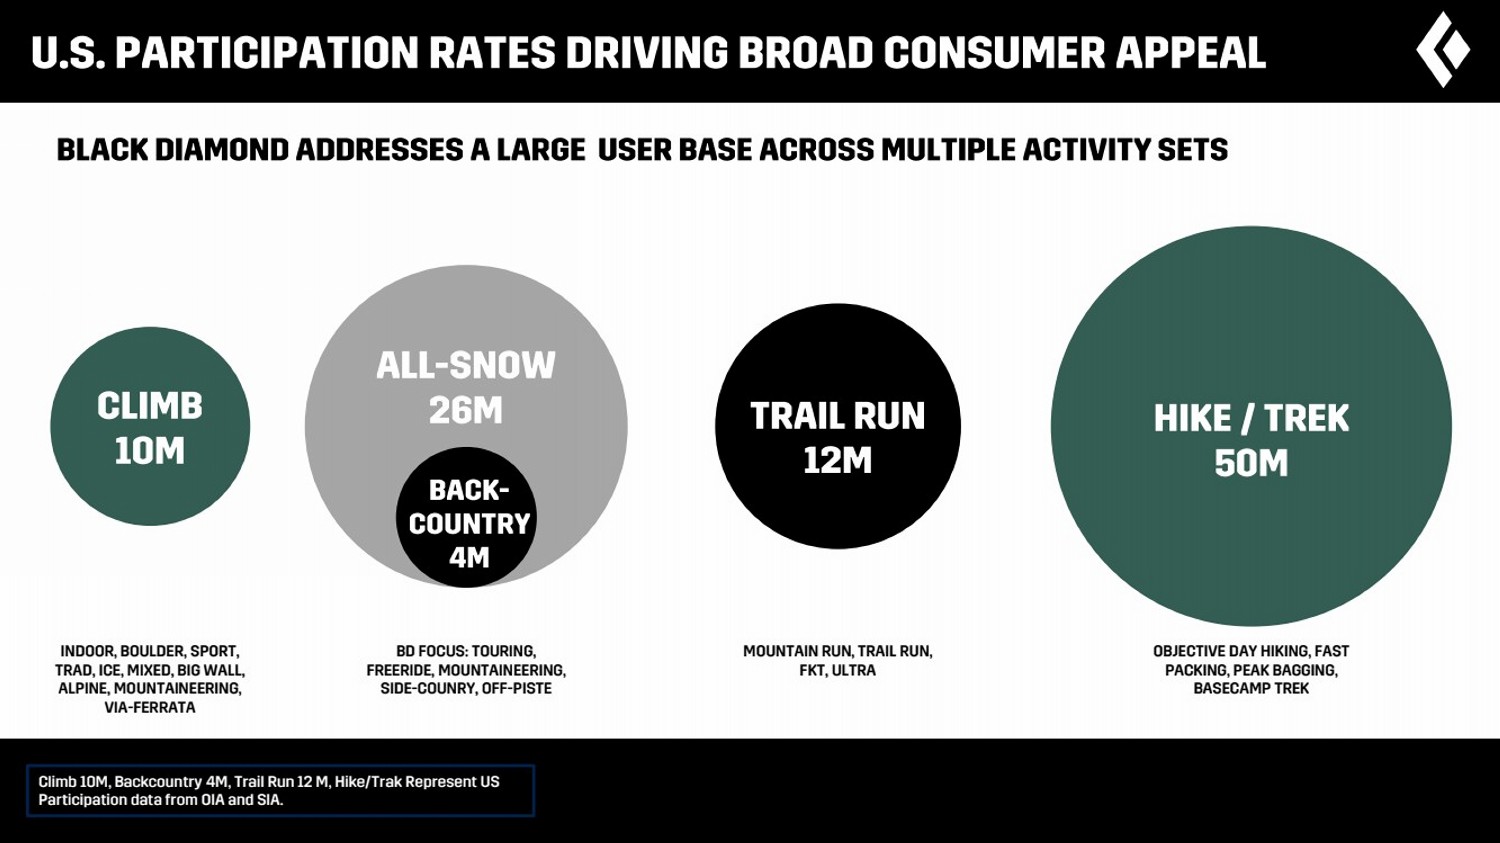
| Climb 10M, Backcountry 4M, Trail Run 12 M, Hike/Trak Represent US Participation data from OIA and SIA. BD FOCUS: TOURING, FREERIDE, MOUNTAINEERING, SIDE-COUNRY, OFF-PISTE INDOOR, BOULDER, SPORT, TRAD, ICE, MIXED, BIG WALL, ALPINE, MOUNTAINEERING, VIA-FERRATA MOUNTAIN RUN, TRAIL RUN, FKT, ULTRA OBJECTIVE DAY HIKING, FAST PACKING, PEAK BAGGING, BASECAMP TREK |
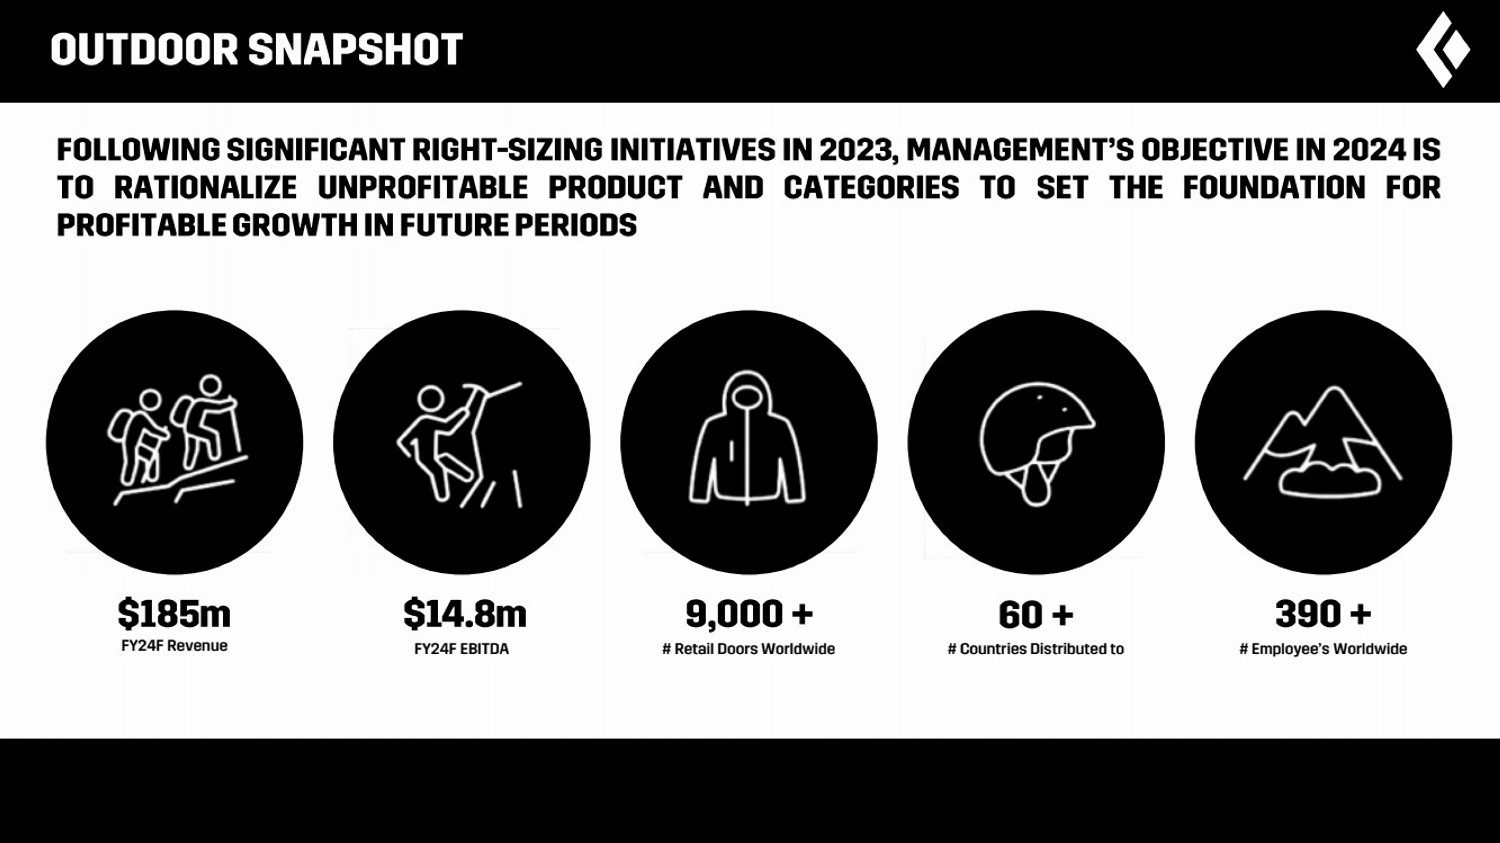
| FY24F Revenue FY24F EBITDA # Retail Doors Worldwide # Countries Distributed to # Employee’s Worldwide |
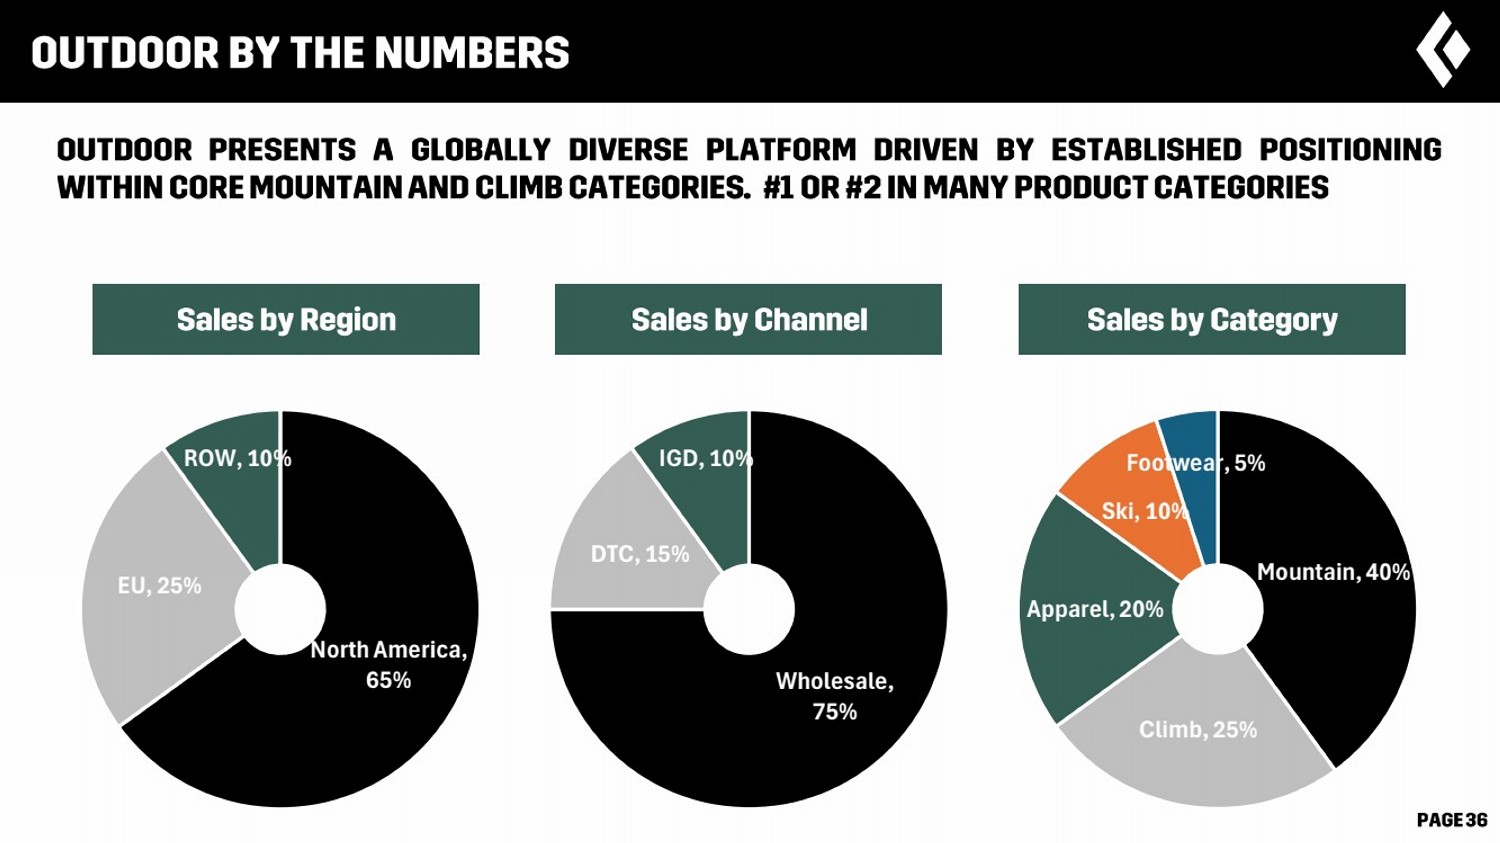
| 6 February 2023 North America, 65% EU, 25% ROW, 10% Wholesale, 75% DTC, 15% IGD, 10% Mountain, 40% Climb, 25% Apparel, 20% Ski, 10% Footwear, 5% |
| 6 February 2023 |
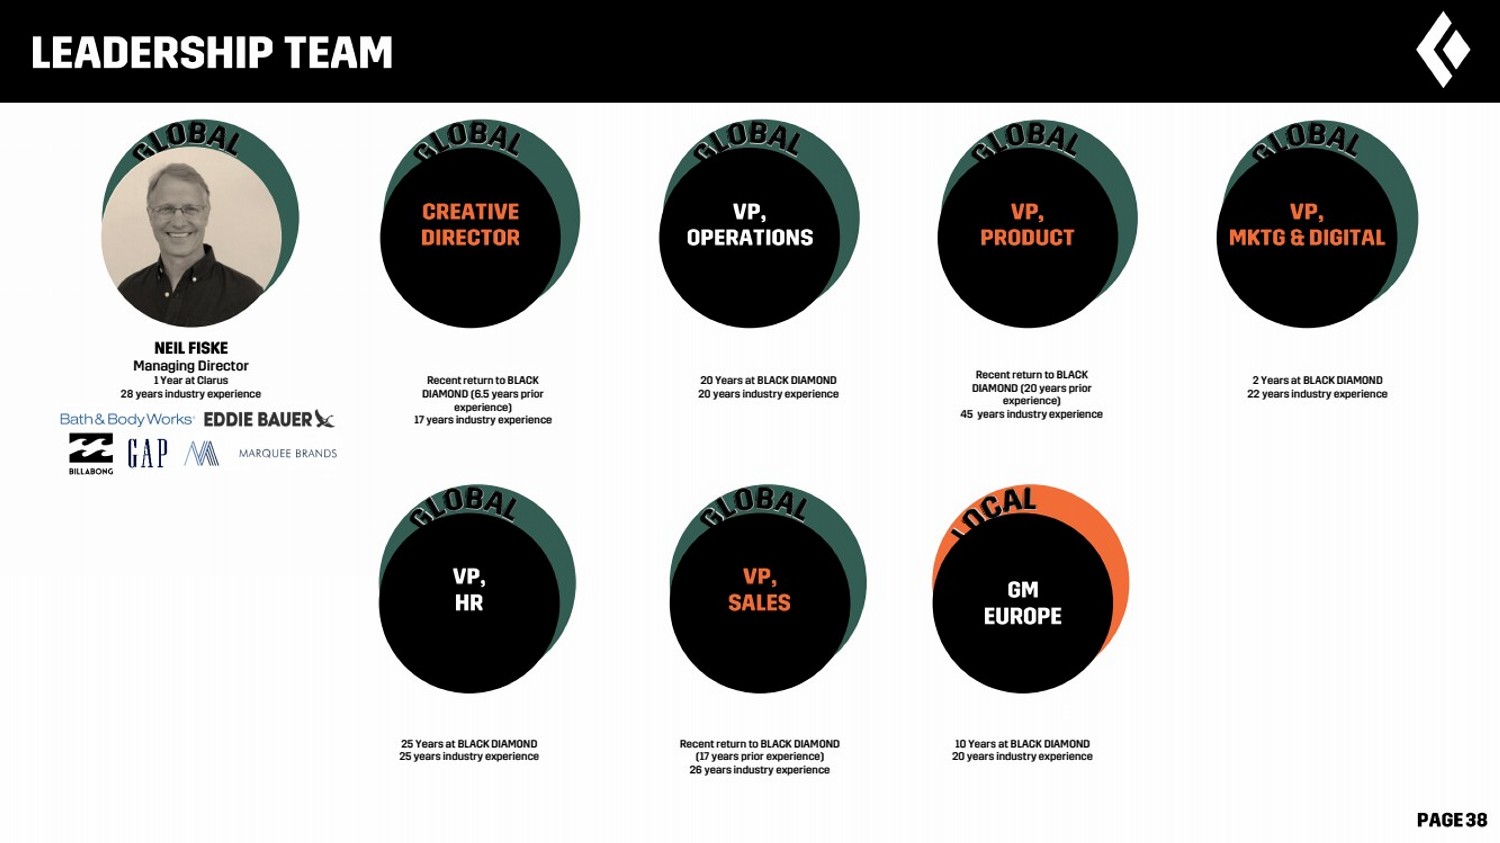
| 6 February 2023 Managing Director 1 Year at Clarus 28 years industry experience Chief Finance Officer Recent return to BLACK DIAMOND (6.5 years prior experience) 17 years industry experience Head of Operations Recent return to BLACK DIAMOND (20 years prior experience) 45 years industry experience Head of Product 20 Years at BLACK DIAMOND 20 years industry experience Head of Marketing & Digital 2 Years at BLACK DIAMOND 22 years industry experience Head of People & Culture 25 Years at BLACK DIAMOND 25 years industry experience GM ANZ 10 Years at BLACK DIAMOND 20 years industry experience Head of People & Culture Recent return to BLACK DIAMOND (17 years prior experience) 26 years industry experience |
| 6 February 2023 |

| 6 February 2023 ▪ ▪ ▪ ▪ |
| 6 February 2023 |
| 6 February 2023 |
| 6 February 2023 |
| 6 February 2023 |
| 6 February 2023 ▪▪▪▪ ▪▪▪ ▪▪ ▪▪▪▪ |
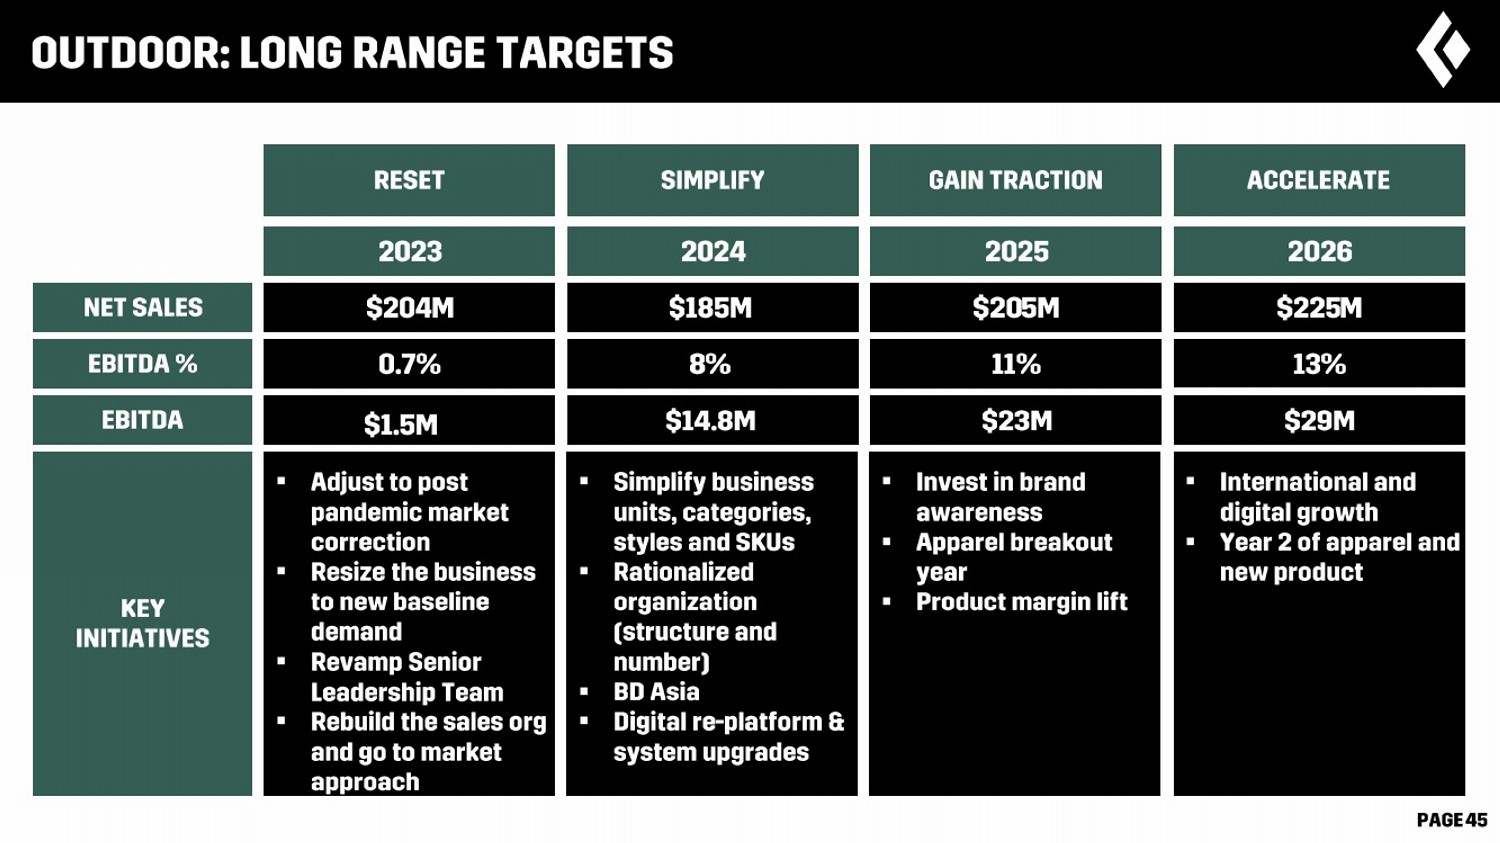
| 6 February 2023 204 |
| 6 February 2023 |
| 6 February 2023 |
|

| 6 February 2023 |
| 6 February 2023 |
|

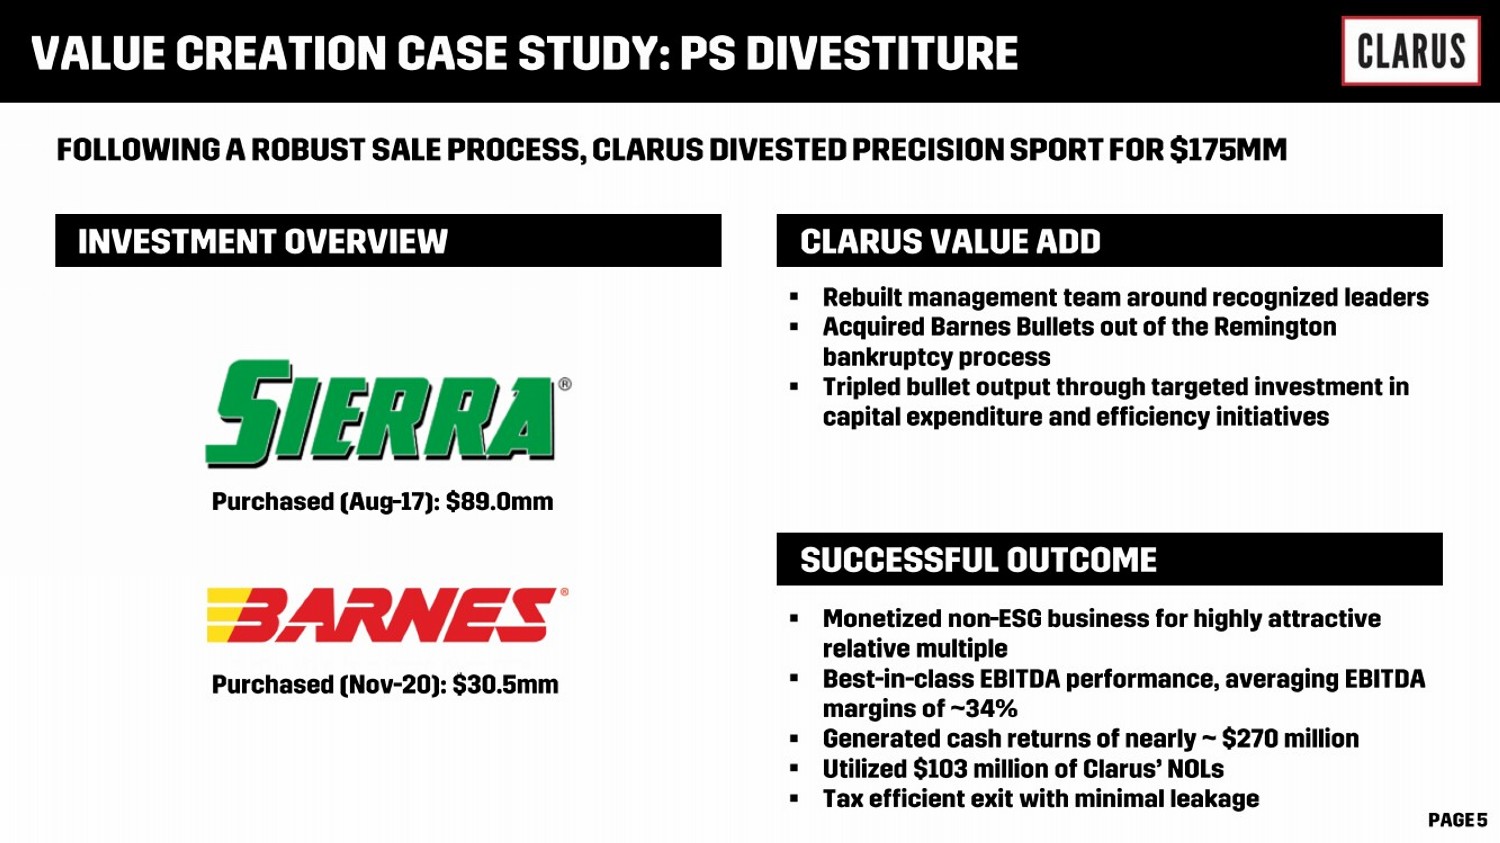
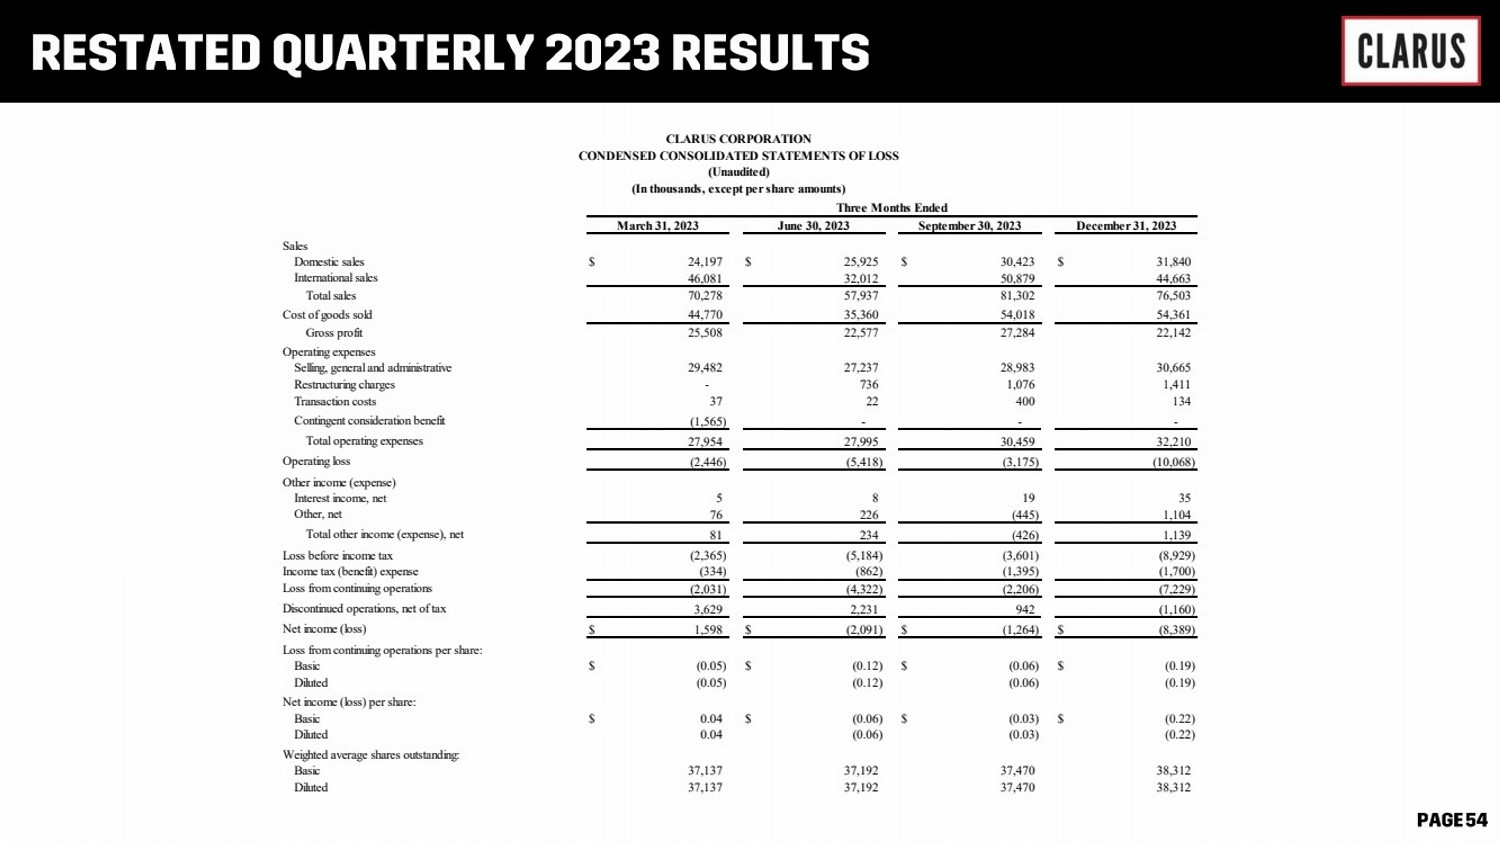
| On December 29, 2023, the Company announced the sale of its Precision Sport segment for $175 million. As the disposition was completed on February 29, 2024, we expect to recognize a gain on the disposition during the three months ending March 31, 2024. The activities of the Precision Sport segment have been segregated and reported as discontinued operations for all periods presented. Certain prior period financial information, related to discontinued operations, have been reclassified and separately presented in the consolidated financial statements and accompanying notes to conform to the current period presentation. The following unaudited financial information is based upon the historical consolidated financial statements of the Company and provides information for continuing operations for each quarter during 2023. |

| 6 February 2023 Sales Domestic sales $ 24,197 $ 25,925 $ 30,423 $ 31,840 International sales 46,081 32,012 50,879 44,663 Total sales 70,278 57,937 81,302 76,503 Cost of goods sold 44,770 35,360 54,018 54,361 Gross profit 25,508 22,577 27,284 22,142 Operating expenses Selling, general and administrative 29,482 27,237 28,983 30,665 Restructuring charges - 736 1,076 1,411 Transaction costs 37 22 400 134 Contingent consideration benefit (1,565) - - - Total operating expenses 27,954 27,995 30,459 32,210 Operating loss (2,446) (5,418) (3,175) (10,068) Other income (expense) Interest income, net 5 8 19 35 Other, net 76 226 (445) 1,104 Total other income (expense), net 81 234 (426) 1,139 Loss before income tax (2,365) (5,184) (3,601) (8,929) Income tax (benefit) expense (334) (862) (1,395) (1,700) Loss from continuing operations (2,031) (4,322) (2,206) (7,229) Discontinued operations, net of tax 3,629 2,231 942 (1,160) Net income (loss) $ 1,598 $ (2,091) $ (1,264) $ (8,389) Loss from continuing operations per share: Basic $ (0.05) $ (0.12) $ (0.06) $ (0.19) Diluted (0.05) (0.12) (0.06) (0.19) Net income (loss) per share: Basic $ 0.04 $ (0.06) $ (0.03) $ (0.22) Diluted 0.04 (0.06) (0.03) (0.22) Weighted average shares outstanding: Basic 37,137 37,192 37,470 38,312 Diluted 37,137 37,192 37,470 38,312 CLARUS CORPORATION CONDENSED CONSOLIDATED STATEMENTS OF LOSS (Unaudited) (In thousands, except per share amounts) Three Months Ended March 31, 2023 June 30, 2023 September 30, 2023 December 31, 2023 |
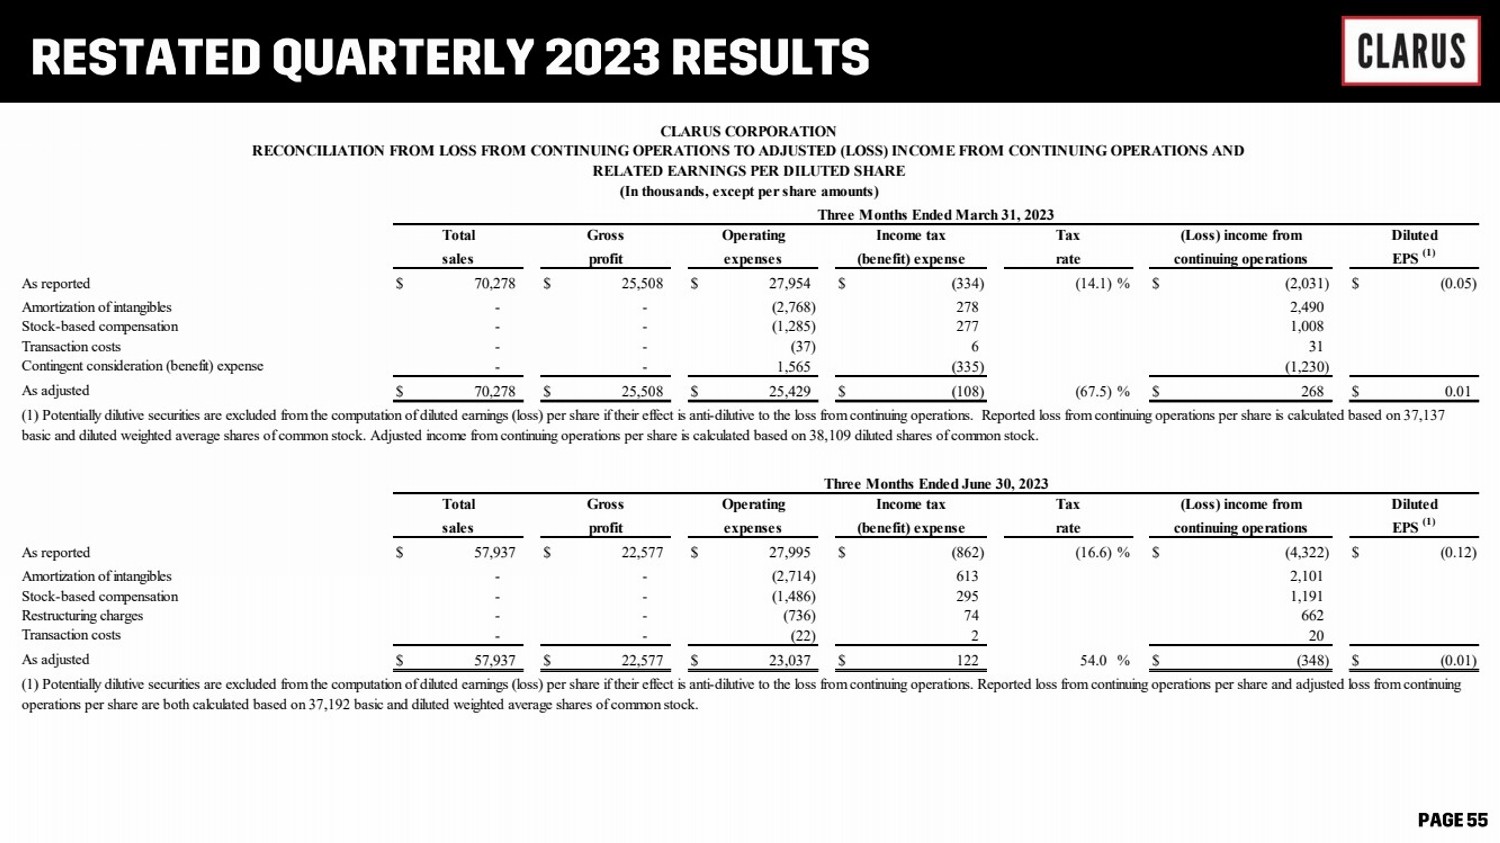
| 6 February 2023 As reported $ 70,278 $ 25,508 $ 27,954 $ (334) (14.1) % $ (2,031) $ (0.05) Amortization of intangibles - - (2,768) 278 2,490 Stock-based compensation - - (1,285) 277 1,008 Transaction costs - - (37) 6 31 Contingent consideration (benefit) expense - - 1,565 (335) (1,230) As adjusted $ 70,278 $ 25,508 $ 25,429 $ (108) (67.5) % $ 268 $ 0.01 As reported $ 57,937 $ 22,577 $ 27,995 $ (862) (16.6) % $ (4,322) $ (0.12) Amortization of intangibles - - (2,714) 613 2,101 Stock-based compensation - - (1,486) 295 1,191 Restructuring charges - - (736) 74 662 Transaction costs - - (22) 2 20 As adjusted $ 57,937 $ 22,577 $ 23,037 $ 122 54.0 % $ (348) $ (0.01) CLARUS CORPORATION RECONCILIATION FROM LOSS FROM CONTINUING OPERATIONS TO ADJUSTED (LOSS) INCOME FROM CONTINUING OPERATIONS AND RELATED EARNINGS PER DILUTED SHARE (In thousands, except per share amounts) Three Months Ended March 31, 2023 Total Gross Operating Income tax Tax (Loss) income from Diluted (benefit) expense rate continuing operations EPS (1) (1) Potentially dilutive securities are excluded from the computation of diluted earnings (loss) per share if their effect is anti-dilutive to the loss from continuing operations. Reported loss from continuing operations per share is calculated based on 37,137 basic and diluted weighted average shares of common stock. Adjusted income from continuing operations per share is calculated based on 38,109 diluted shares of common stock. sales profit expenses Three Months Ended June 30, 2023 Total Gross Operating Income tax continuing operations EPS (1) (1) Potentially dilutive securities are excluded from the computation of diluted earnings (loss) per share if their effect is anti-dilutive to the loss from continuing operations. Reported loss from continuing operations per share and adjusted loss from continuing operations per share are both calculated based on 37,192 basic and diluted weighted average shares of common stock. Tax (Loss) income from Diluted sales profit expenses (benefit) expense rate |
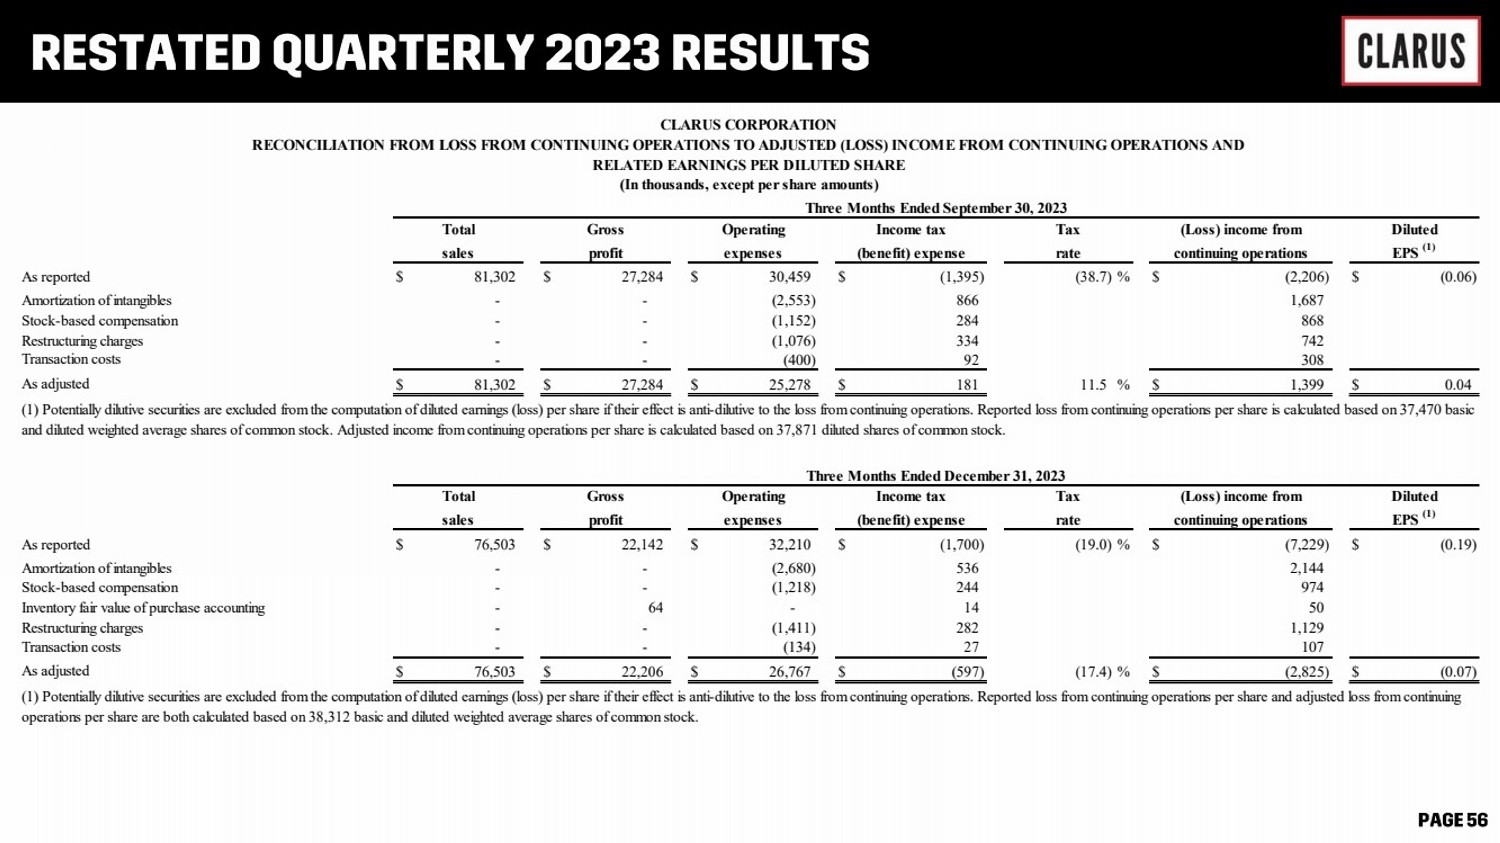
| 6 February 2023 As reported $ 81,302 $ 27,284 $ 30,459 $ (1,395) (38.7) % $ (2,206) $ (0.06) Amortization of intangibles - - (2,553) 866 1,687 Stock-based compensation - - (1,152) 284 868 Restructuring charges - - (1,076) 334 742 Transaction costs - - (400) 92 308 As adjusted $ 81,302 $ 27,284 $ 25,278 $ 181 11.5 % $ 1,399 $ 0.04 As reported $ 76,503 $ 22,142 $ 32,210 $ (1,700) (19.0) % $ (7,229) $ (0.19) Amortization of intangibles - - (2,680) 536 2,144 Stock-based compensation - - (1,218) 244 974 Inventory fair value of purchase accounting - 64 - 14 50 Restructuring charges - - (1,411) 282 1,129 Transaction costs - - (134) 27 107 As adjusted $ 76,503 $ 22,206 $ 26,767 $ (597) (17.4) % $ (2,825) $ (0.07) CLARUS CORPORATION RECONCILIATION FROM LOSS FROM CONTINUING OPERATIONS TO ADJUSTED (LOSS) INCOME FROM CONTINUING OPERATIONS AND RELATED EARNINGS PER DILUTED SHARE (In thousands, except per share amounts) Three Months Ended September 30, 2023 Total Gross Operating Income tax Tax (Loss) income from Diluted (benefit) expense rate continuing operations EPS (1) (1) Potentially dilutive securities are excluded from the computation of diluted earnings (loss) per share if their effect is anti-dilutive to the loss from continuing operations. Reported loss from continuing operations per share is calculated based on 37,470 basic and diluted weighted average shares of common stock. Adjusted income from continuing operations per share is calculated based on 37,871 diluted shares of common stock. sales profit expenses Three Months Ended December 31, 2023 Total Gross Operating Income tax Tax (Loss) income from Diluted (benefit) expense rate continuing operations EPS (1) (1) Potentially dilutive securities are excluded from the computation of diluted earnings (loss) per share if their effect is anti-dilutive to the loss from continuing operations. Reported loss from continuing operations per share and adjusted loss from continuing operations per share are both calculated based on 38,312 basic and diluted weighted average shares of common stock. sales profit expenses |
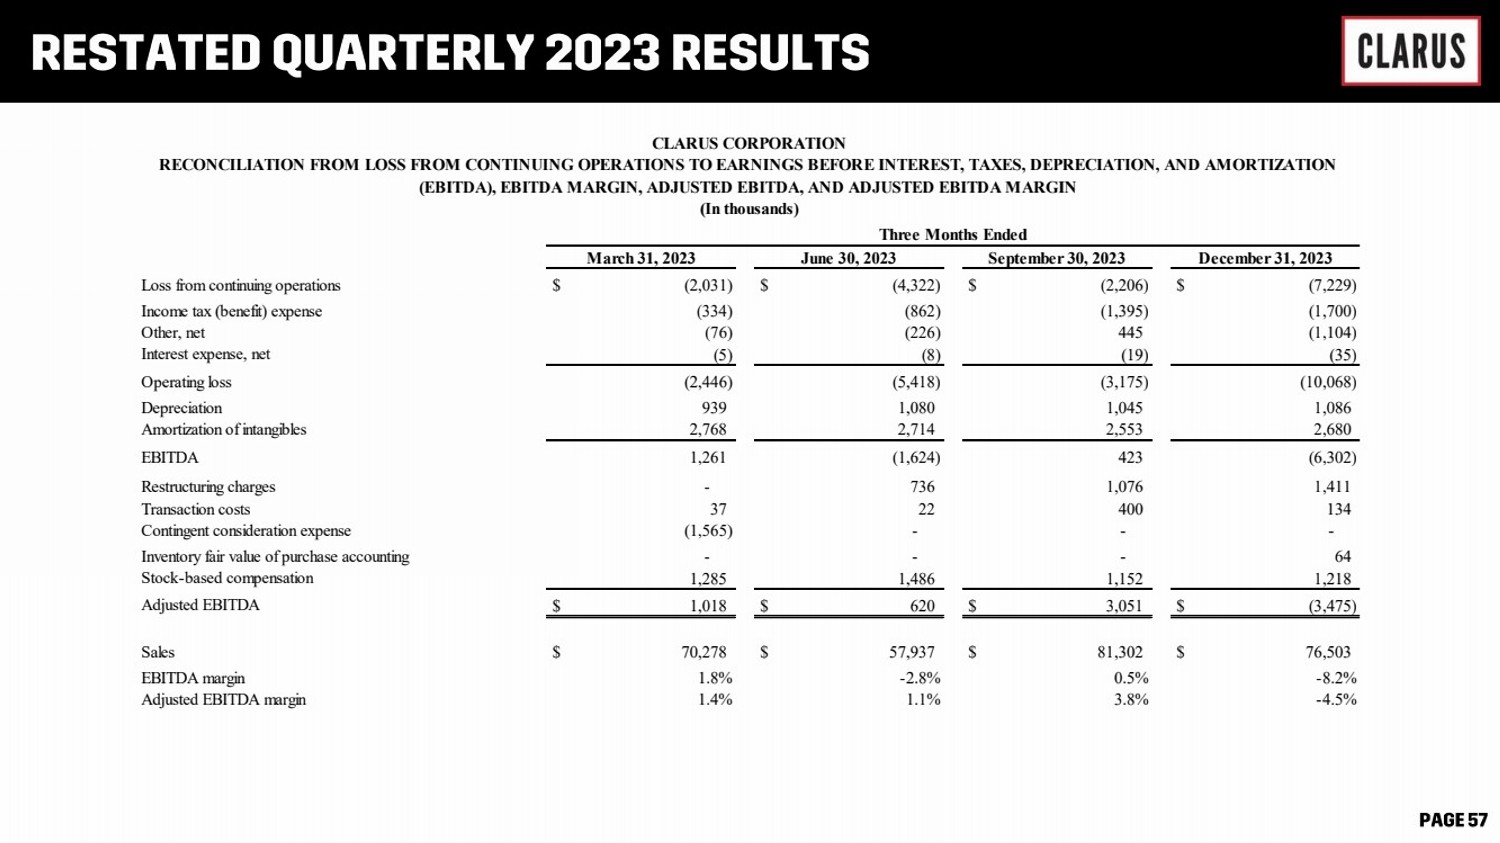
| 6 February 2023 Loss from continuing operations $ (2,031) $ (4,322) $ (2,206) $ (7,229) Income tax (benefit) expense (334) (862) (1,395) (1,700) Other, net (76) (226) 445 (1,104) Interest expense, net (5) (8) (19) (35) Operating loss (2,446) (5,418) (3,175) (10,068) Depreciation 939 1,080 1,045 1,086 Amortization of intangibles 2,768 2,714 2,553 2,680 EBITDA 1,261 (1,624) 423 (6,302) Restructuring charges - 736 1,076 1,411 Transaction costs 37 22 400 134 Contingent consideration expense (1,565) - - - Inventory fair value of purchase accounting - - - 64 Stock-based compensation 1,285 1,486 1,152 1,218 Adjusted EBITDA $ 1,018 $ 620 $ 3,051 $ (3,475) Sales $ 70,278 $ 57,937 $ 81,302 $ 76,503 EBITDA margin 1.8% -2.8% 0.5% -8.2% Adjusted EBITDA margin 1.4% 1.1% 3.8% -4.5% CLARUS CORPORATION RECONCILIATION FROM LOSS FROM CONTINUING OPERATIONS TO EARNINGS BEFORE INTEREST, TAXES, DEPRECIATION, AND AMORTIZATION (EBITDA), EBITDA MARGIN, ADJUSTED EBITDA, AND ADJUSTED EBITDA MARGIN (In thousands) March 31, 2023 June 30, 2023 September 30, 2023 December 31, 2023 Three Months Ended |
|