
Exhibit 99.2

Q2 EARNINGS PRESENTATION AUGUST 1 , 2024
6 February 2023 PAGE 2 Forward - Looking Statements Please note that in this presentation we may use words such as “appears,” “anticipates,” “believes,” “plans,” “expects,” “int end s,” “future,” and similar expressions which constitute forward - looking statements within the meaning of the safe harbor provisions of the Private Securities Litigation Reform Act of 1995. Forward - looking statem ents are made based on our expectations and beliefs concerning future events impacting the Company and therefore involve a number of risks and uncertainties. We caution that forward - looking statements are not guarantees and that actual results could differ materially from those expressed or implied in the forward - looking statements. Potential risks and uncertainties that could cause the actual results of operations or financial condition of the Company to differ materially from those expressed or implied by forward - looking statements in this presentation, include, but are not limited to, those risks and uncert ainties more fully described from time to time in the Company's public reports filed with the Securities and Exchange Commission, including under the section titled “Risk Factors” in the Company's Annual Report on Form 10 - K, and/or Quarterly Reports on Form 10 - Q, as well as in the Company’s Current Reports on Form 8 - K. All forward - looking statements included in this presentation are based upon information available t o the Company as of the date of this presentation and speak only as of the date hereof. We assume no obligation to update any forward - looking statements to reflect events or circumstances after the date of t his presentation. Non - GAAP Financial Measures The Company reports its financial results in accordance with U.S. generally accepted accounting principles (“GAAP”). This pre sen tation contains the non - GAAP measures: ( i ) adjusted gross margin and adjusted gross profit, (ii) adjusted (loss) income from continuing operations and related earnings (loss) per diluted share, (iii) ear nin gs before interest, taxes, other income or expense, depreciation and amortization (“EBITDA”), EBITDA margin, adjusted EBITDA, and adjusted EBITDA margin , (iv) segment EBITDA and adjusted segment EBITDA, and (v) free cash flow (defined as net cash provided by operating activities less capital expenditures). The Company believes that the presentation of certain non - GAAP measures, i.e.: ( i ) adjusted gross margin and adjusted gross profit, (ii) adjusted (loss) income from continuing operations and related earnings (loss) per diluted share , (iii) EBITDA, EBITDA margin, adjusted EBITDA and adjusted EBITDA margin, (iv) segment EBITDA and adjusted segment EBITDA, an d (v) free cash flow, provide useful information for the understanding of its ongoing operations and enables investors to focus on period - over - period operating per formance, and thereby enhances the user's overall understanding of the Company's current financial performance relative to past performance and provides, along with the nearest GAAP measures, a ba sel ine for modeling future earnings expectations. Non - GAAP measures are reconciled to comparable GAAP financial measures herein. We do not provide a reconciliation of the non - GAAP guidance measures, i.e.: ( i ) a djusted EBITDA, adjusted EBITDA m argin, and mid - point adjusted EBITDA margin (ii) adjusted corporate costs, and (iii) adjusted free cash flow for the fiscal year 2024 to the most comparab le GAAP financial measure, due to the inherent difficulty of forecasting certain types of expenses and gains, without unreasonable effort. The Company cautions that non - GAAP measures should be considered in addition to, but not as a substitute for, the Company's repo rted GAAP results. Additionally, the Company notes that there can be no assurance that the above referenced non - GAAP financial measures are compara ble to similarly titled financial measures used by other publicly traded companies. Market and Industry Data The market and industry data used throughout this presentation was obtained from various sources, including the Company’s own re search and estimates, surveys or studies conducted by third parties and industry or general publications and forecasts. Industry publications, surveys and forecasts generally state that they have o bta ined information from sources believed to be reliable, but there can be no assurance as to the accuracy and completeness of such information. While the Company believes that each of these surveys, studies, publ ica tions and forecasts is reliable, it has not independently verified such data and the Company is not making any representation as to the accuracy of such information. Similarly, the Company believes its internal re search and estimates are reliable but it has not been verified by any independent sources. In addition, while the Company believes that the industry and market information included herein is generally reliab le, such information is inherently imprecise. While the Company is not aware of any misstatements regarding the industry and market data presented herein, its estimates involve risks and uncertainties and are sub ject to change based on various factors, including those discussed under the heading “Forward - Looking Statements” above. DISCLAIMER

Warren Kanders EXECUTIVE CHAIRMAN Clarus TODAY’S PRESENTERS Mike Yates CFO Clarus Neil Fiske PRESIDENT Black Diamond Equipment Mat Hayward MANAGING DIRECTOR Adventure
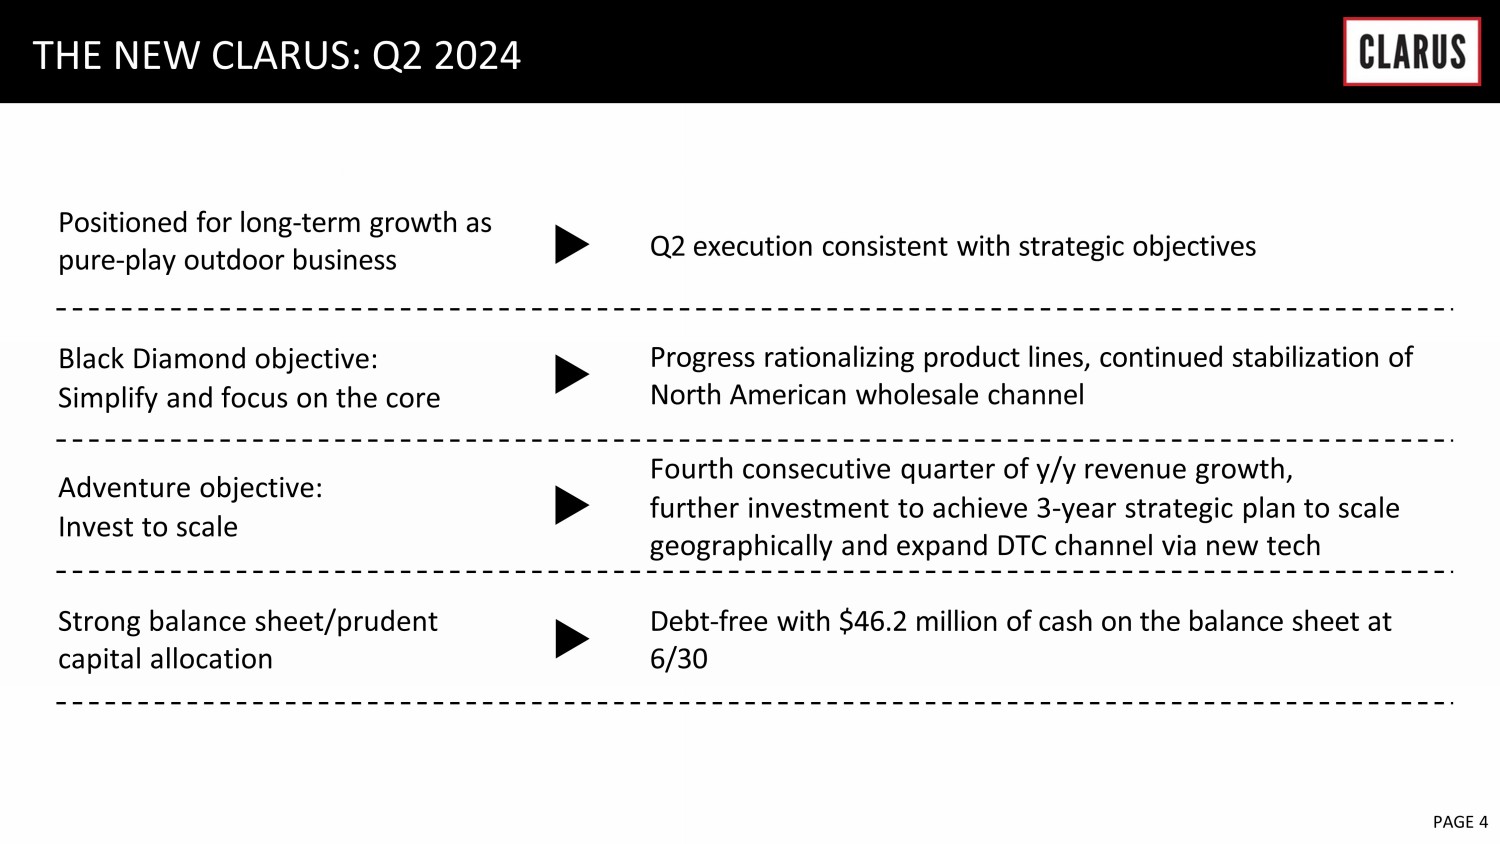
6 February 2023 PAGE 4 THE NEW CLARUS: Q2 2024 Positioned for long - term growth as pure - play outdoor business Q2 execution consistent with strategic objectives Black Diamond objective : Simplify and focus on the core Progress rationalizing product lines, continued stabilization of North American wholesale channel Adventure objective: Invest to scale Fourth consecutive quarter of y/y revenue growth, further investment to achieve 3 - year strategic plan to scale geographically and expand DTC channel via new tech Strong balance sheet/ p rudent capital allocation Debt - free with $46.2 million of cash on the balance sheet at 6/30
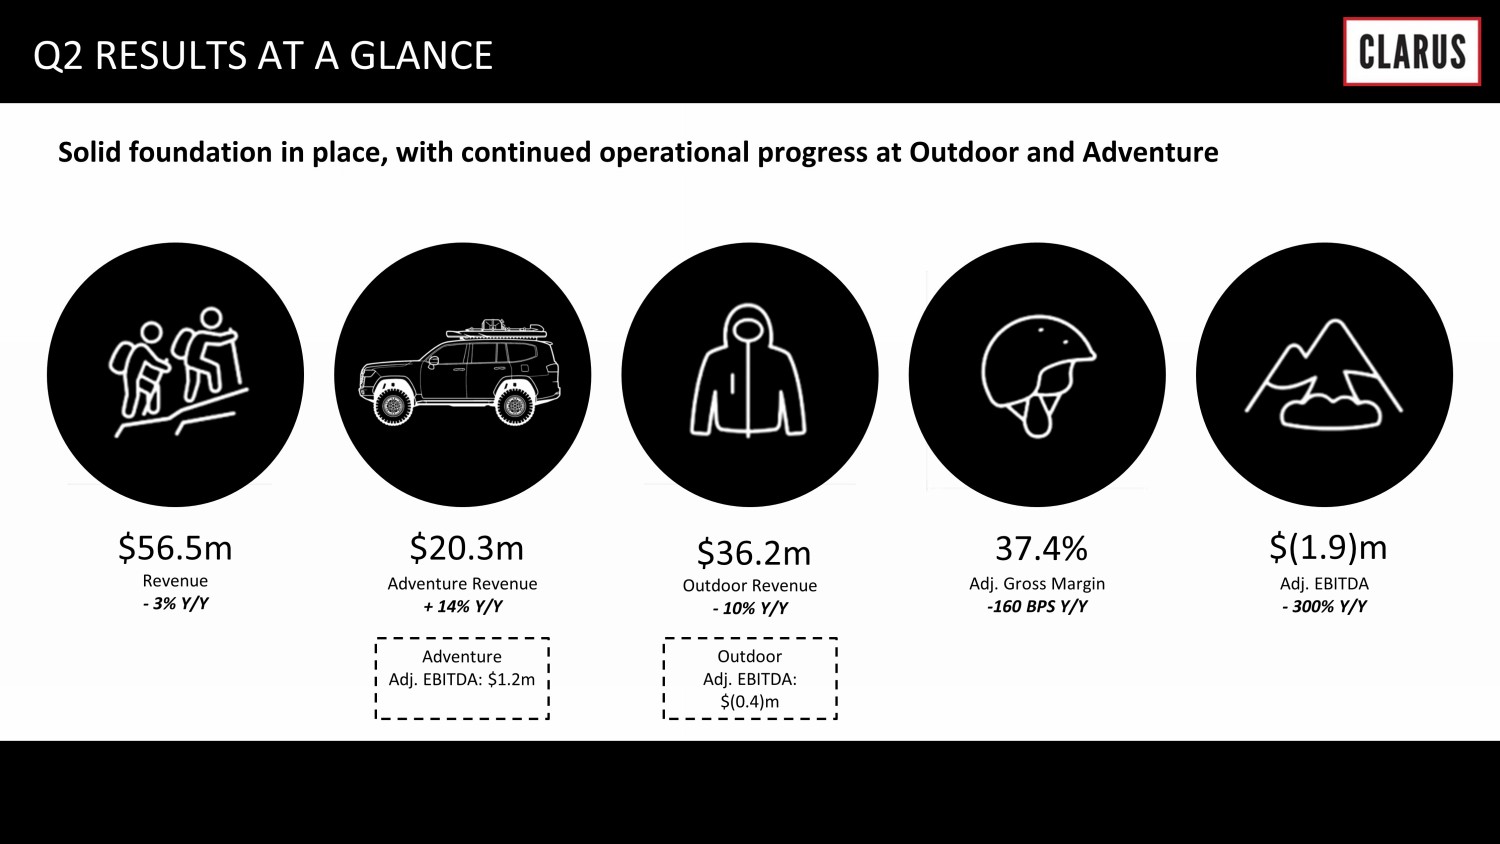
Solid foundation in place, with continued operational progress at Outdoor and Adventure $56 .5m $20.3 m $ 36.2m 37.4 % $( 1.9 ) m Revenue - 3% Y/Y Adventure Revenue + 14% Y/Y Outdoor Revenue - 10% Y/Y Adj. Gross Margin - 160 BPS Y/Y Adj. EBITDA - 300% Y/Y Q2 RESULTS AT A GLANCE Adventure Adj. EBITDA: $1.2m Outdoor Adj. EBITDA: $(0.4)m
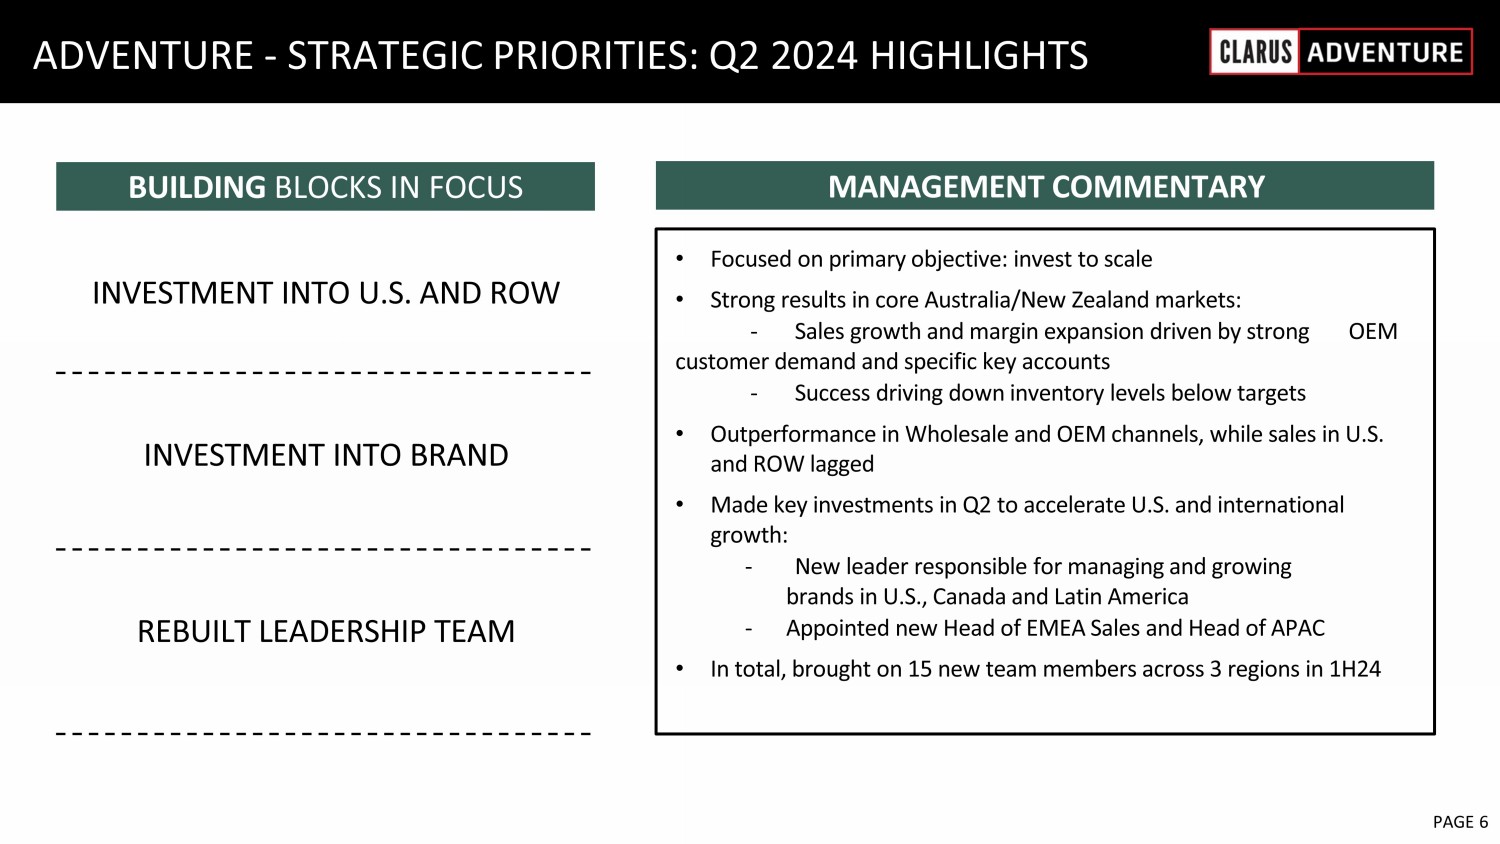
6 February 2023 PAGE 6 ADVENTURE - STRATEGIC PRIORITIES: Q2 2024 HIGHLIGHTS • Focused on primary objective: invest to scale • Strong results in core Australia/New Zealand markets: - Sales growth and margin expansion driven by strong OEM customer demand and specific key accounts - Success driving down inventory levels below targets • Outperformance in Wholesale and OEM channels, while sales in U.S. and ROW lagged • Made key investments in Q2 to accelerate U.S. and international growth: - New leader responsible for managing and growing brands in U.S., Canada and Latin America - Appointed new Head of EMEA Sales and Head of APAC • In total, brought on 15 new team members across 3 regions in 1H24 MANAGEMENT COMMENTARY BUILDING BLOCKS IN FOCUS INVESTMENT INTO U.S. AND ROW INVESTMENT INTO BRAND REBUILT LEADERSHIP TEAM
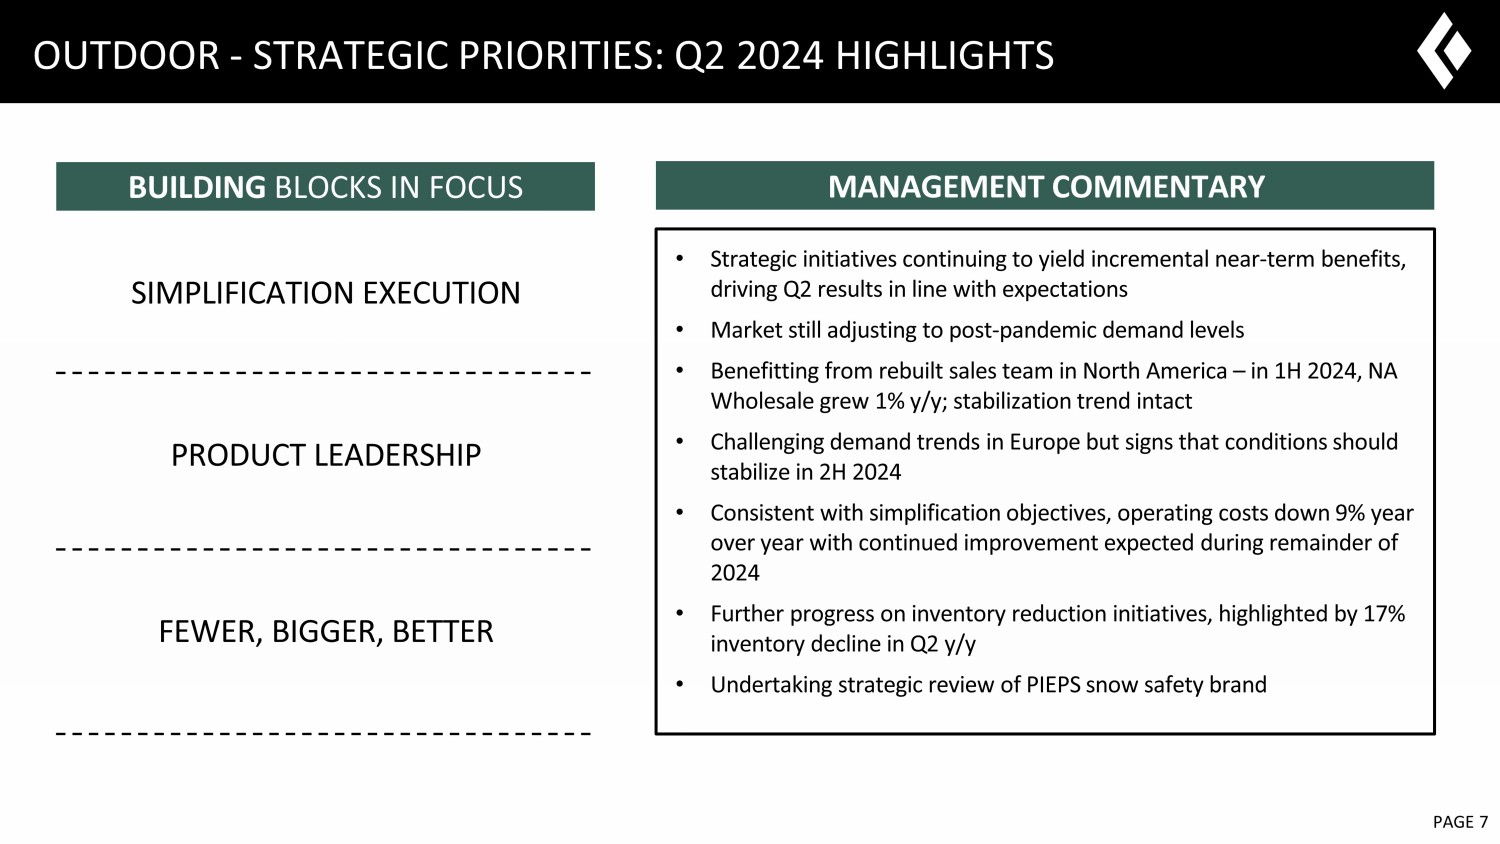
6 February 2023 PAGE 7 OUTDOOR - STRATEGIC PRIORITIES: Q2 2024 HIGHLIGHTS • Strategic initiatives continuing to yield incremental near - term benefits, driving Q2 results in line with expectations • Market still adjusting to post - pandemic demand levels • Benefitting from rebuilt sales team in North America – in 1H 2024, NA Wholesale grew 1% y/y; stabilization trend intact • Challenging demand trends in Europe but signs that conditions should stabilize in 2H 2024 • Consistent with simplification objectives, operating costs down 9% year over year with continued improvement expected during remainder of 2024 • Further progress on inventory reduction initiatives, highlighted by 17% inventory decline in Q2 y/y • Undertaking strategic review of PIEPS snow safety brand MANAGEMENT COMMENTARY BUILDING BLOCKS IN FOCUS SIMPLIFICATION EXECUTION PRODUCT LEADERSHIP FEWER, BIGGER, BETTER
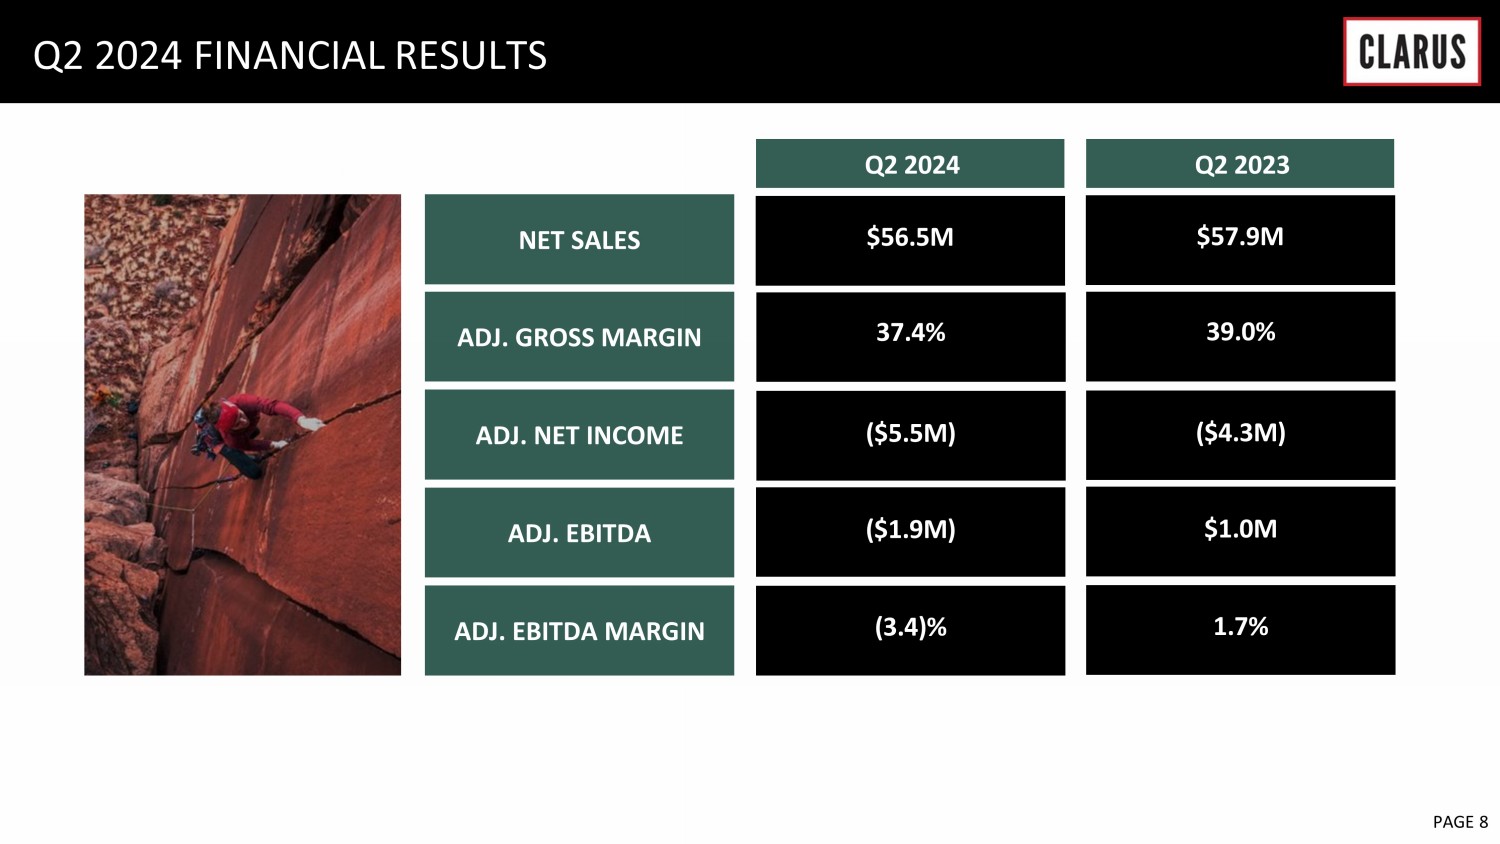
6 February 2023 PAGE 8 NET SALES Q2 2024 FINANCIAL RESULTS Q2 202 4 Q2 2023 ADJ. GROSS MARGIN ADJ. NET INCOME ADJ. EBITDA ADJ. EBITDA MARGIN (3.4)% ( $ 1.9 M) ($5.5M) 37.4 % $56.5M 1.7% $1.0M ($4.3M) 39.0% $ 57.9 M
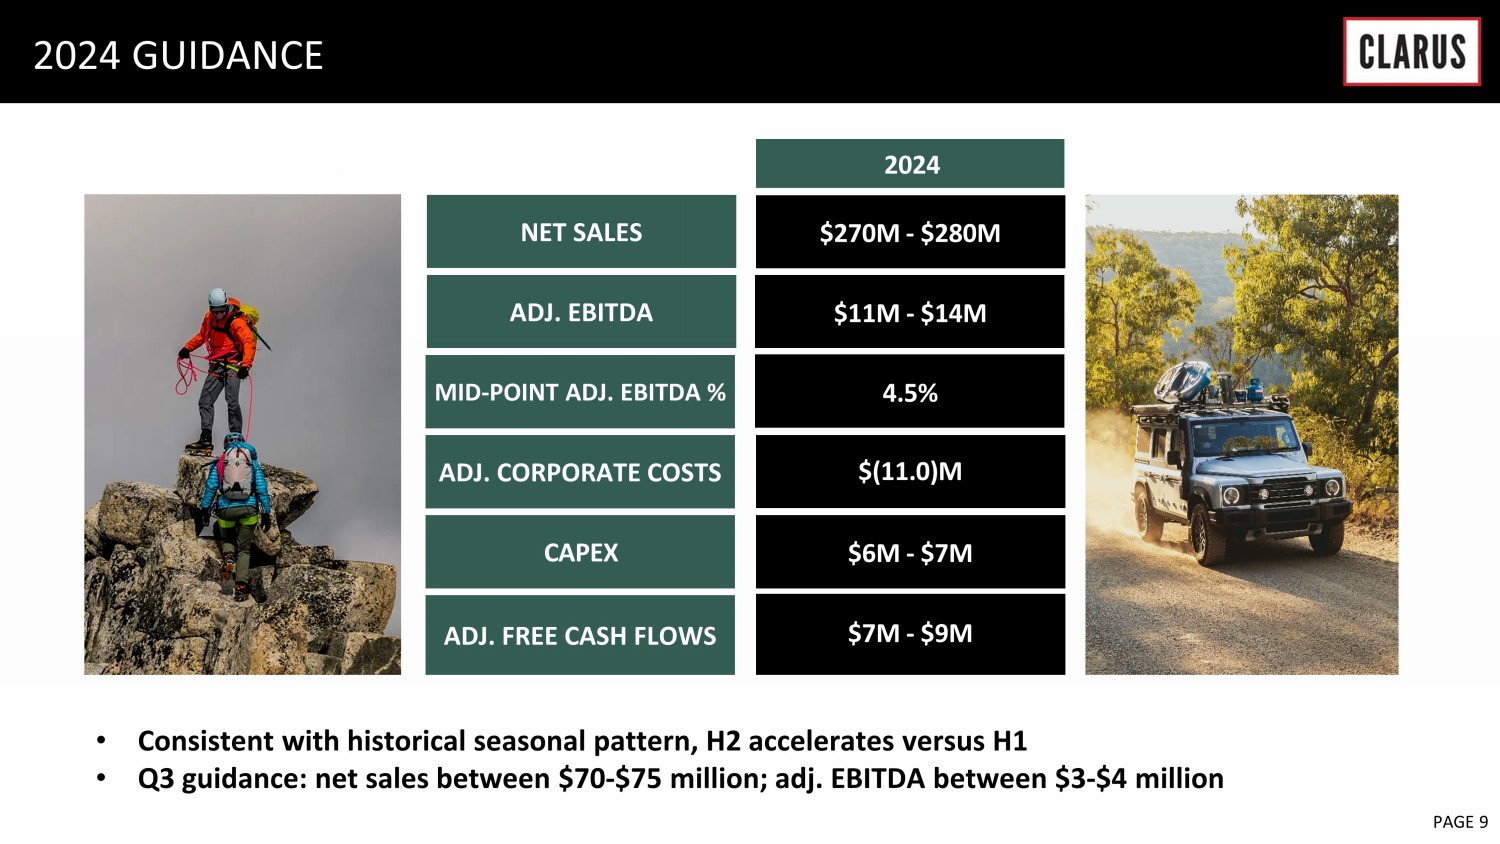
6 February 2023 PAGE 9 NET SALES 2024 GUIDANCE ADJ. CORPORATE COSTS ADJ. EBITDA MID - POINT ADJ. EBITDA % CAPEX ADJ. FREE CASH FLOWS $270M - $280M $6M - $7M $11M - $14M 4 .5% $(11.0)M $7M - $ 9 M 2024 • Consistent with historical seasonal pattern, H 2 accelerates versus H 1 • Q 3 guidance : net sales between $ 70 - $ 75 million ; adj . EBITDA between $ 3 - $ 4 million

APPENDIX
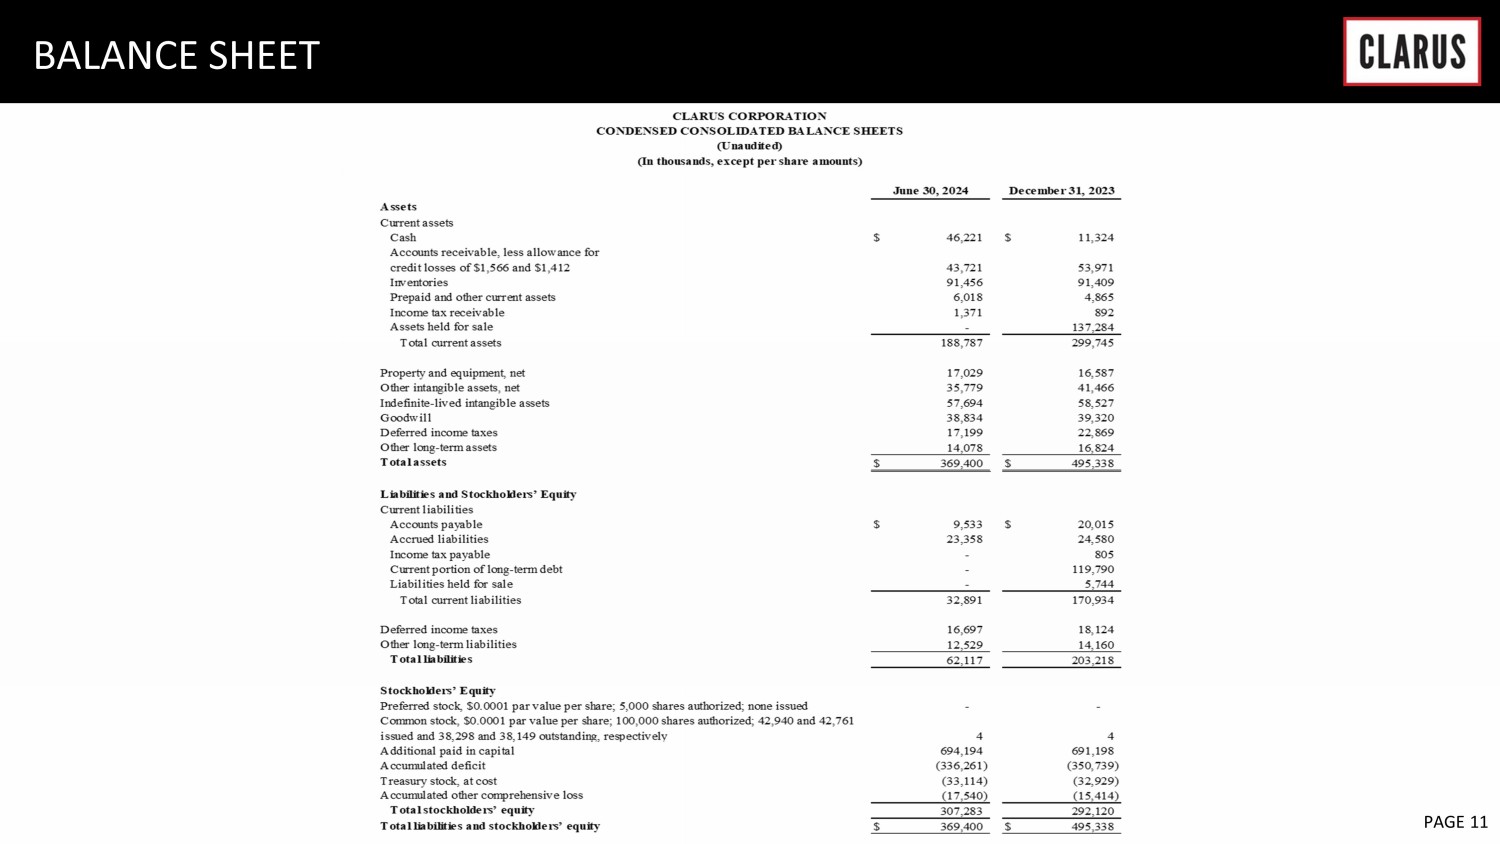
6 February 2023 PAGE 11 BALANCE SHEET
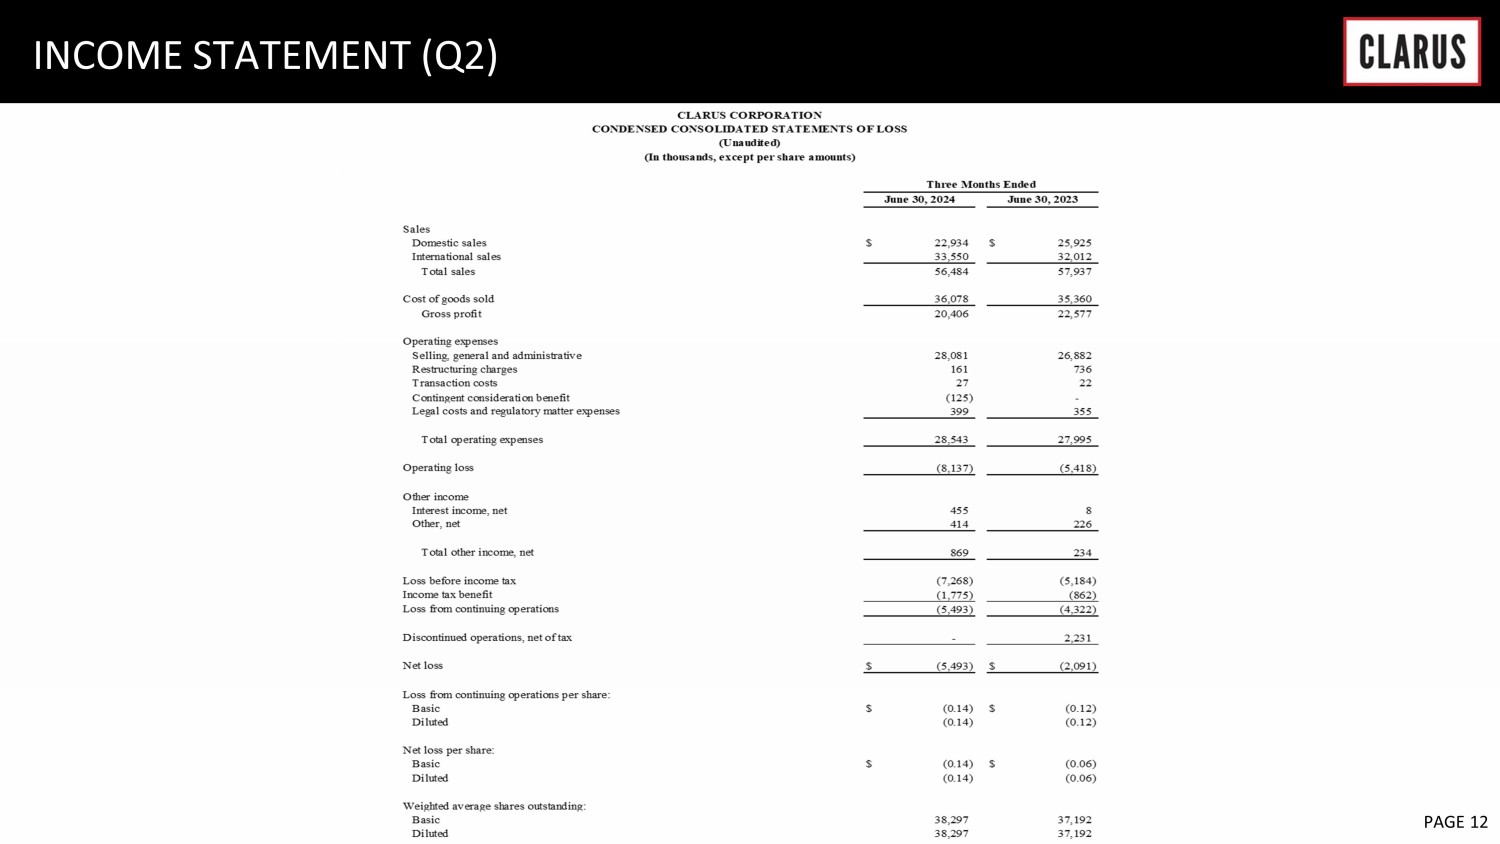
6 February 2023 PAGE 12 INCOME STATEMENT (Q2)
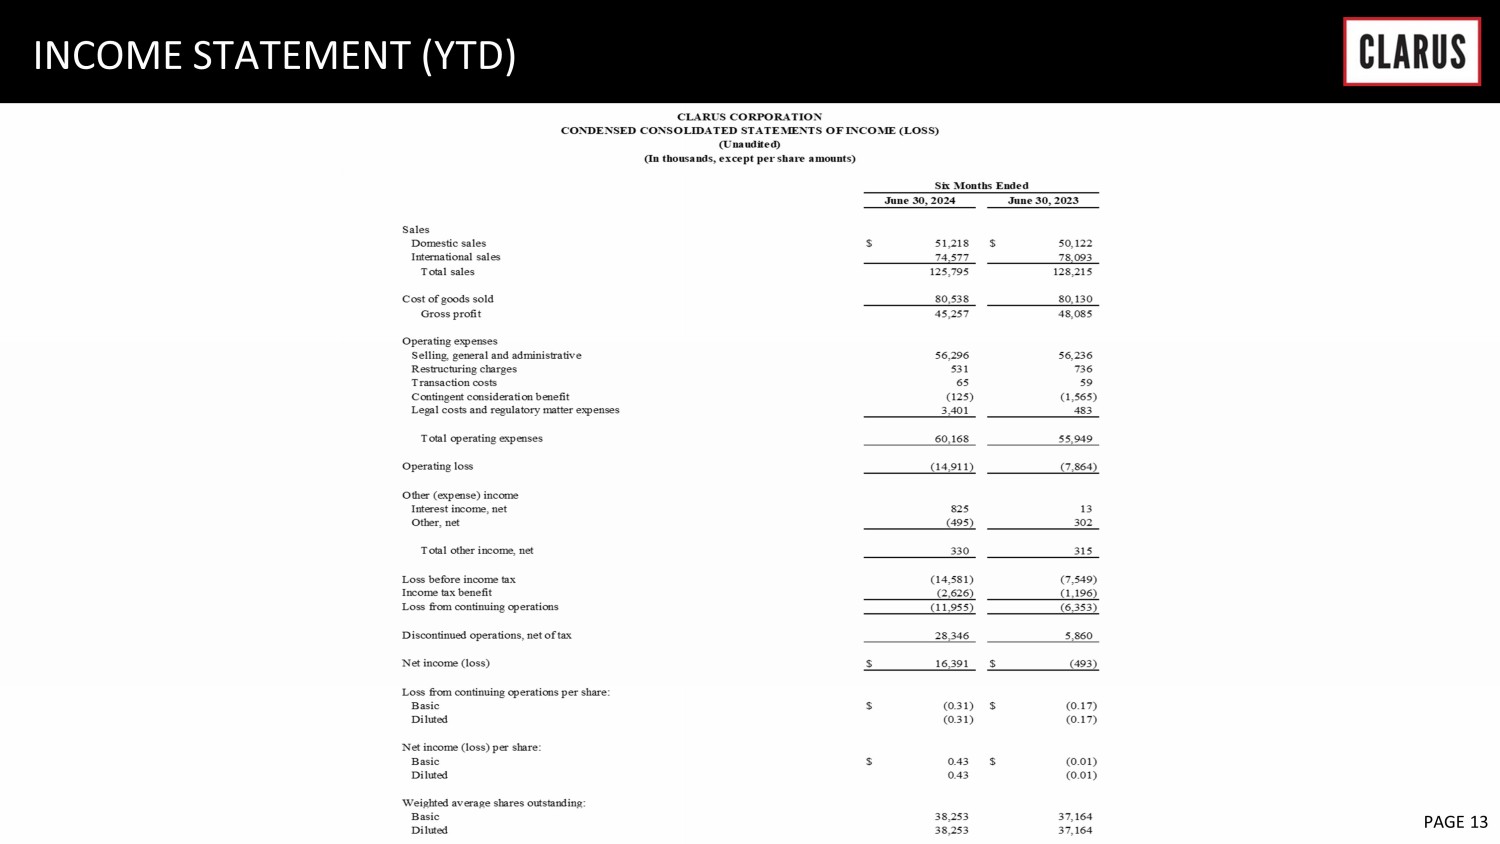
6 February 2023 PAGE 13 INCOME STATEMENT (YTD)
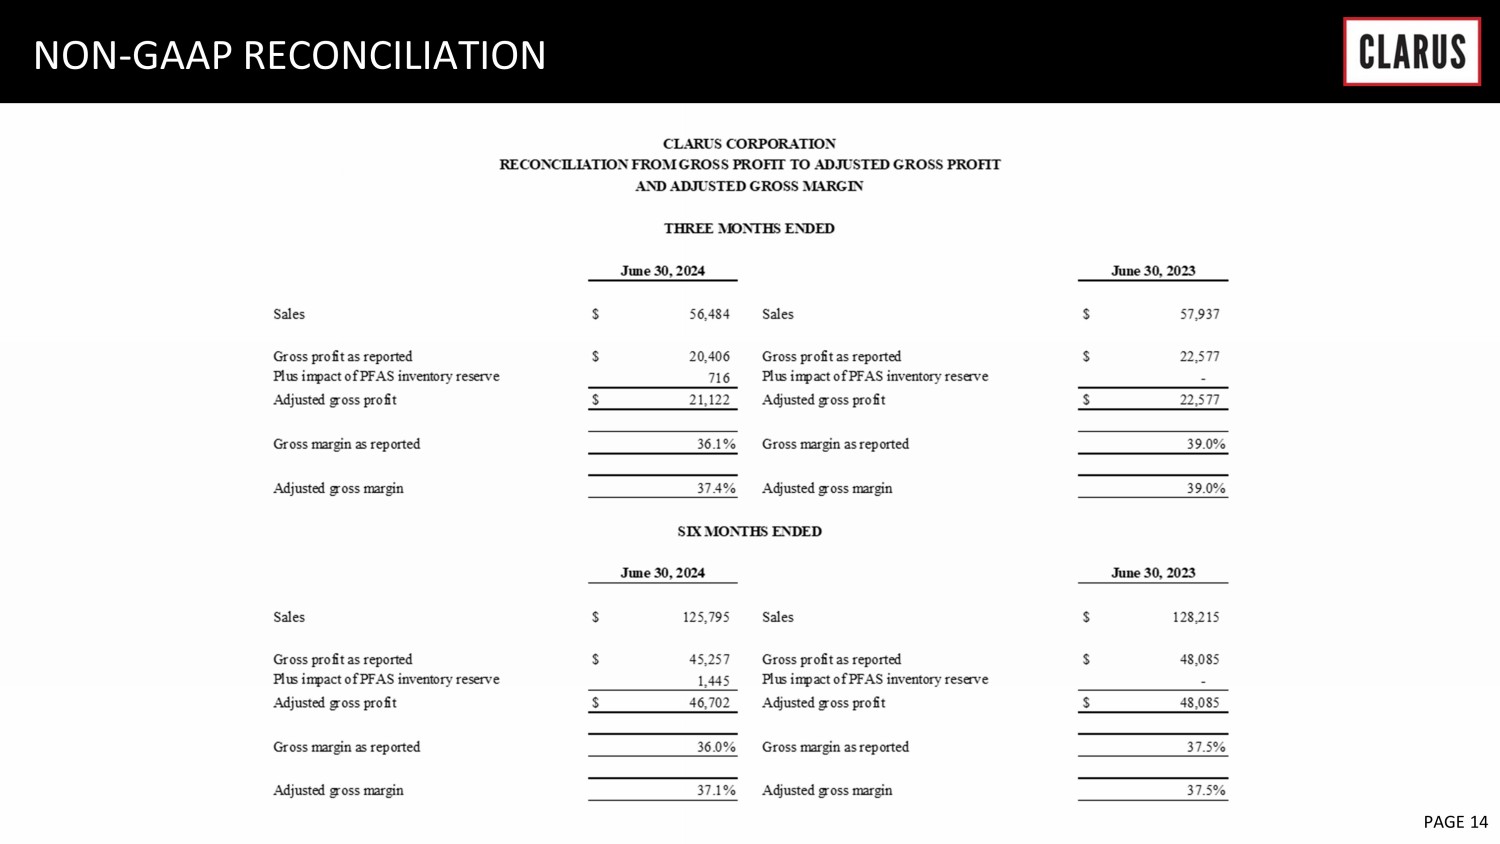
6 February 2023 PAGE 14 NON - GAAP RECONCILIATION
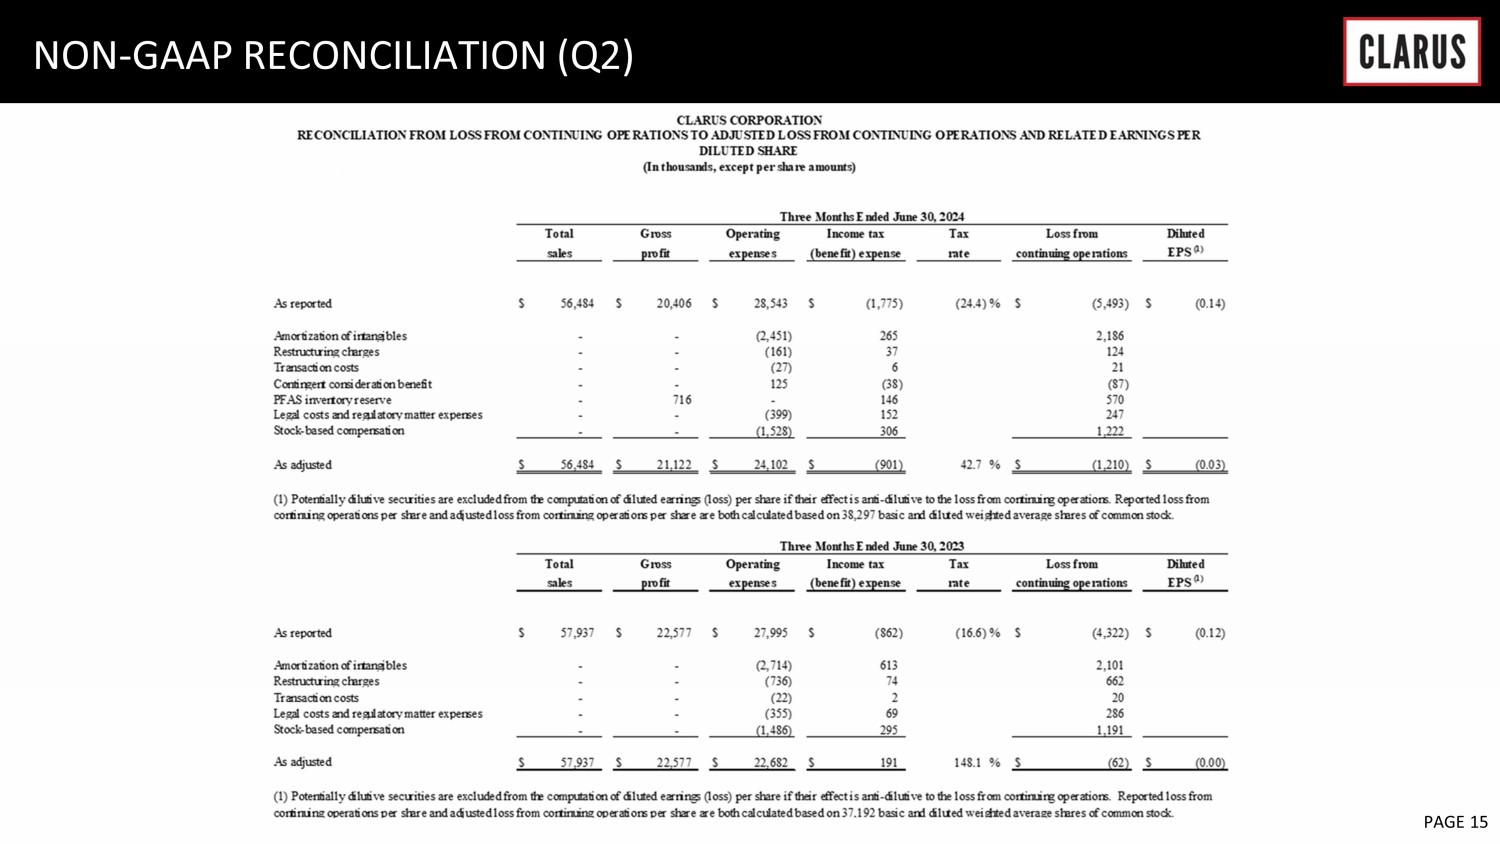
6 February 2023 PAGE 15 NON - GAAP RECONCILIATION (Q2)
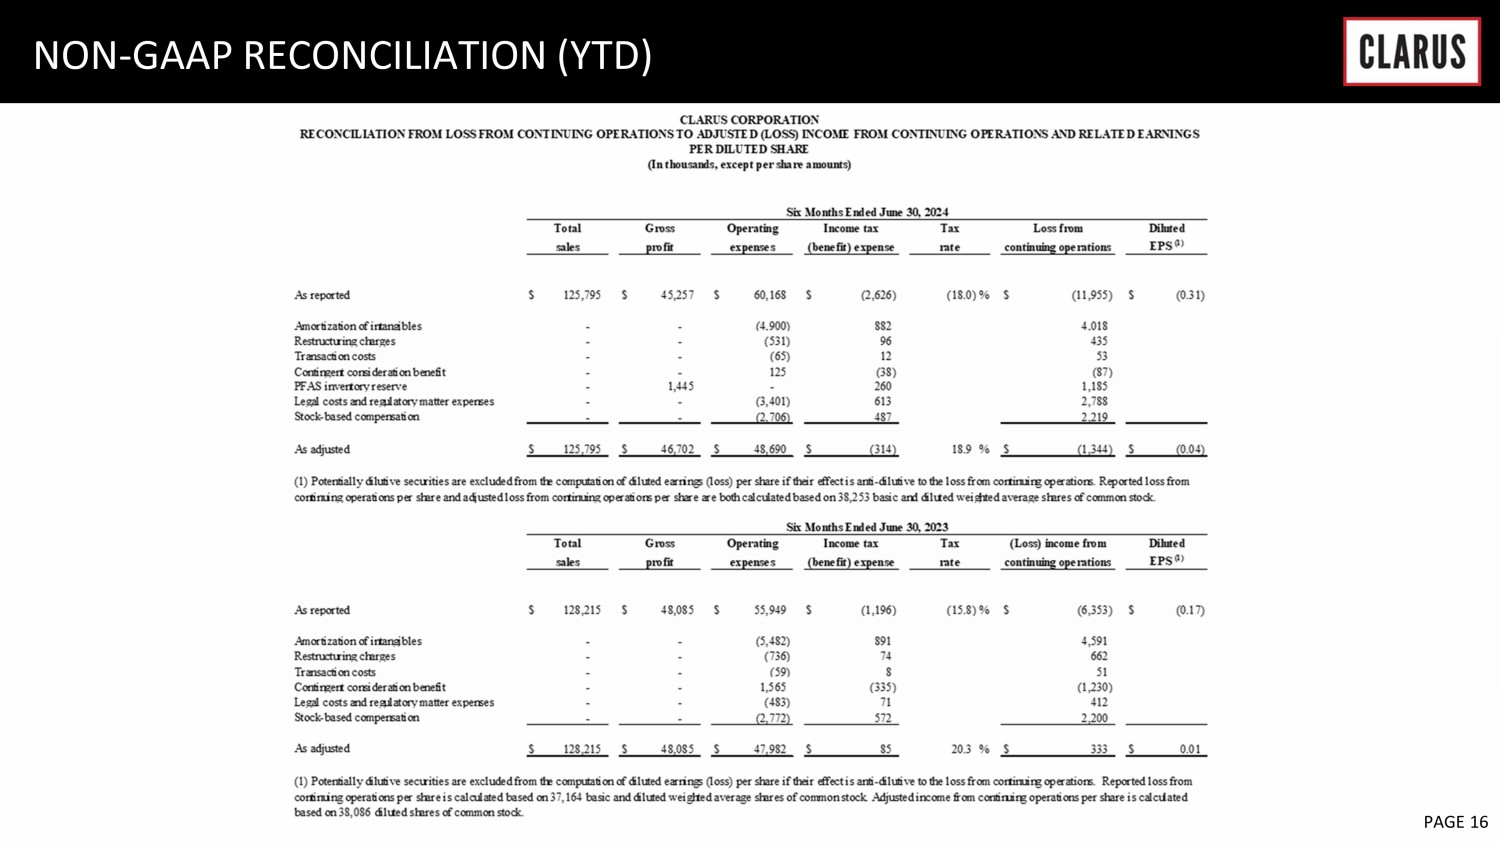
6 February 2023 PAGE 16 NON - GAAP RECONCILIATION (YTD)
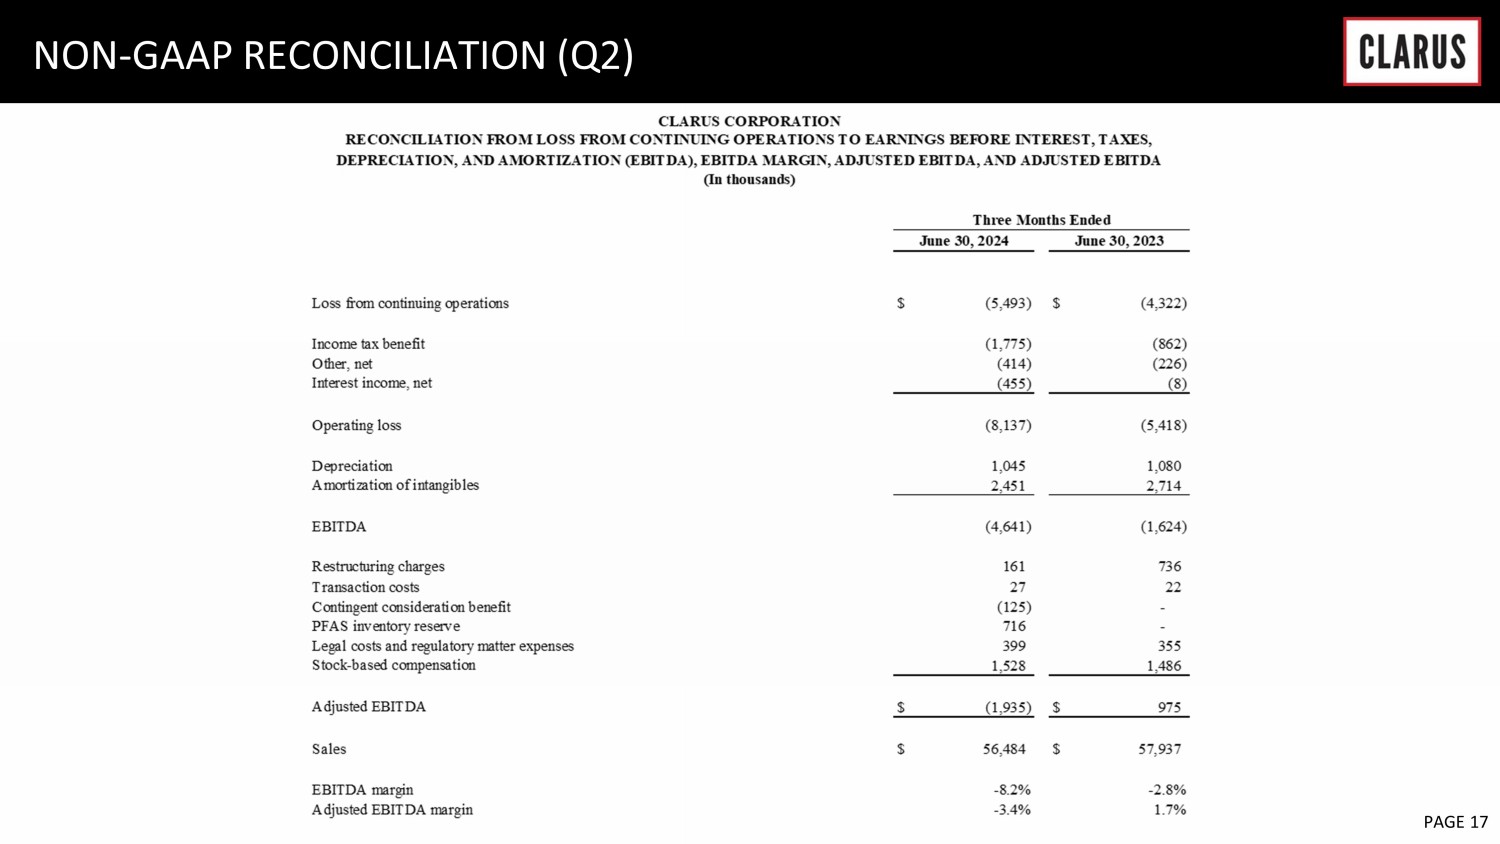
6 February 2023 PAGE 17 NON - GAAP RECONCILIATION (Q2)
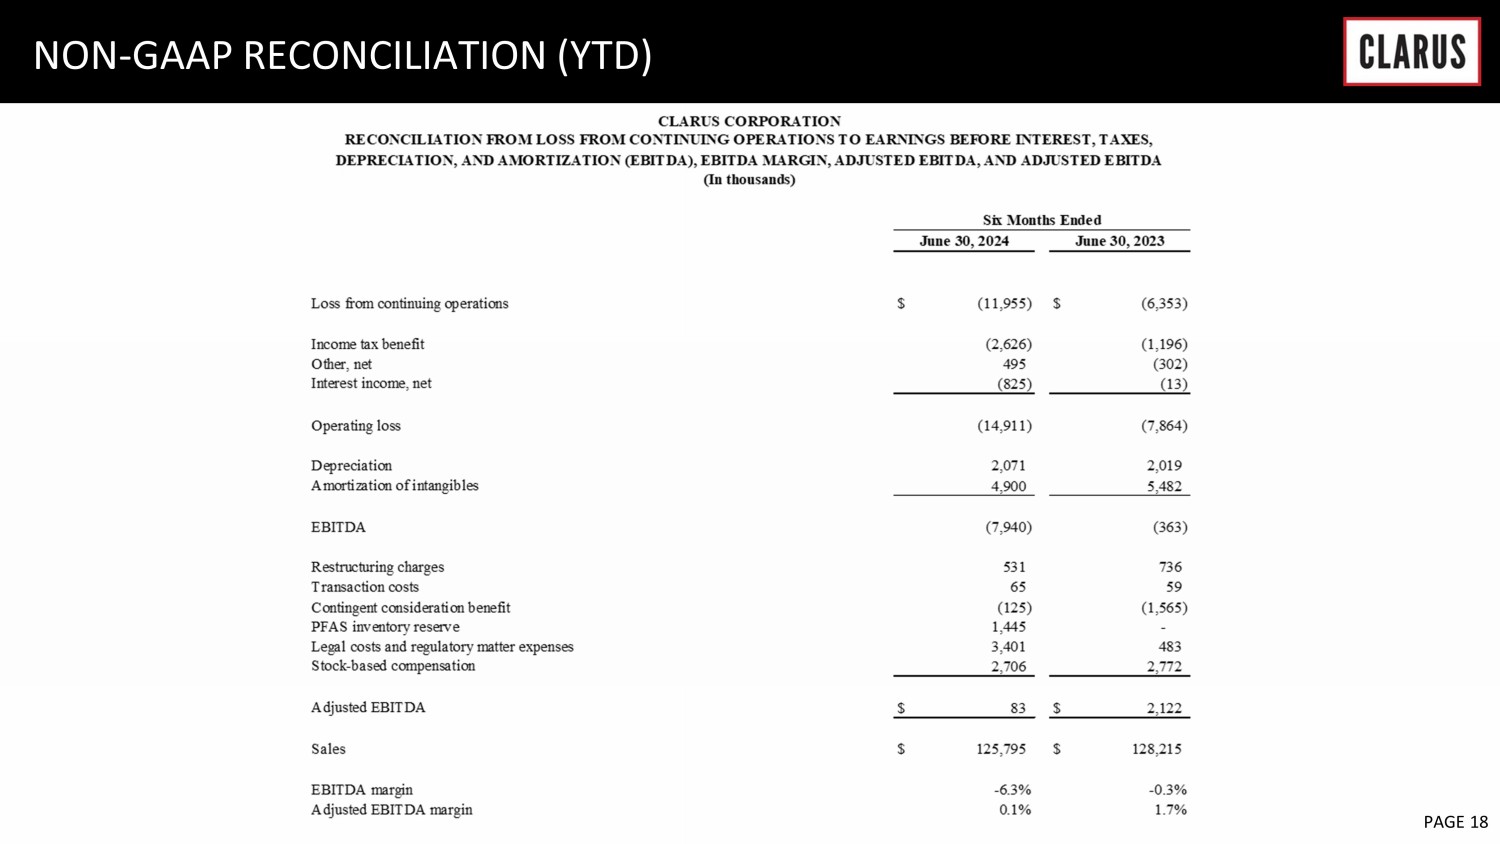
6 February 2023 PAGE 18 NON - GAAP RECONCILIATION (YTD)
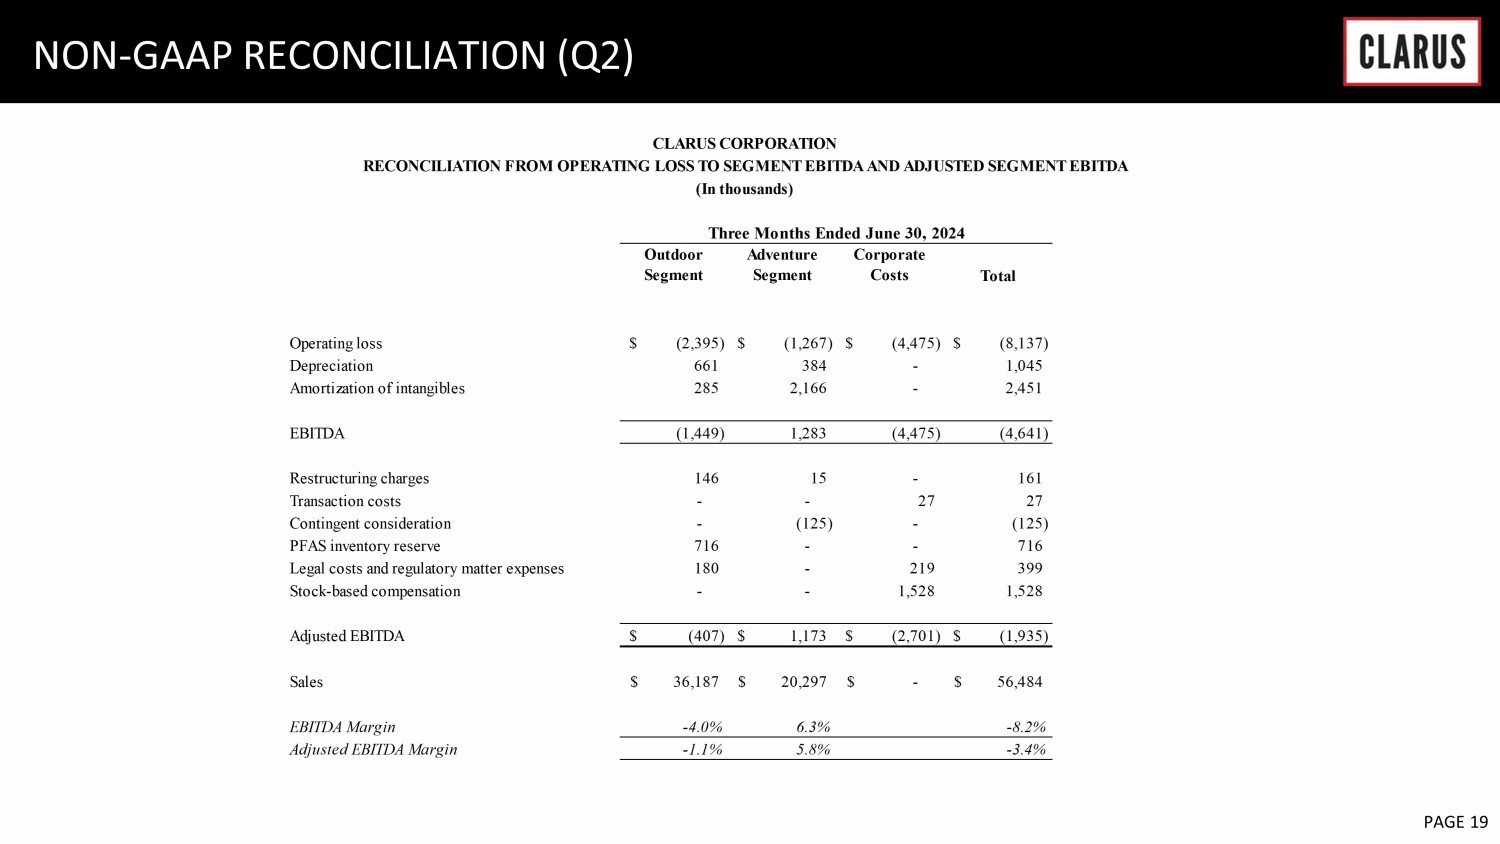
6 February 2023 PAGE 19 NON - GAAP RECONCILIATION (Q2) Outdoor Segment Adventure Segment Corporate Costs Total Operating loss (2,395)$ (1,267)$ (4,475)$ (8,137)$ Depreciation 661 384 - 1,045 Amortization of intangibles 285 2,166 - 2,451 EBITDA (1,449) 1,283 (4,475) (4,641) Restructuring charges 146 15 - 161 Transaction costs - - 27 27 Contingent consideration - (125) - (125) PFAS inventory reserve 716 - - 716 Legal costs and regulatory matter expenses 180 - 219 399 Stock-based compensation - - 1,528 1,528 Adjusted EBITDA (407)$ 1,173$ (2,701)$ (1,935)$ Sales 36,187$ 20,297$ -$ 56,484$ EBITDA Margin -4.0% 6.3% -8.2% Adjusted EBITDA Margin -1.1% 5.8% -3.4% CLARUS CORPORATION (In thousands) RECONCILIATION FROM OPERATING LOSS TO SEGMENT EBITDA AND ADJUSTED SEGMENT EBITDA Three Months Ended June 30, 2024
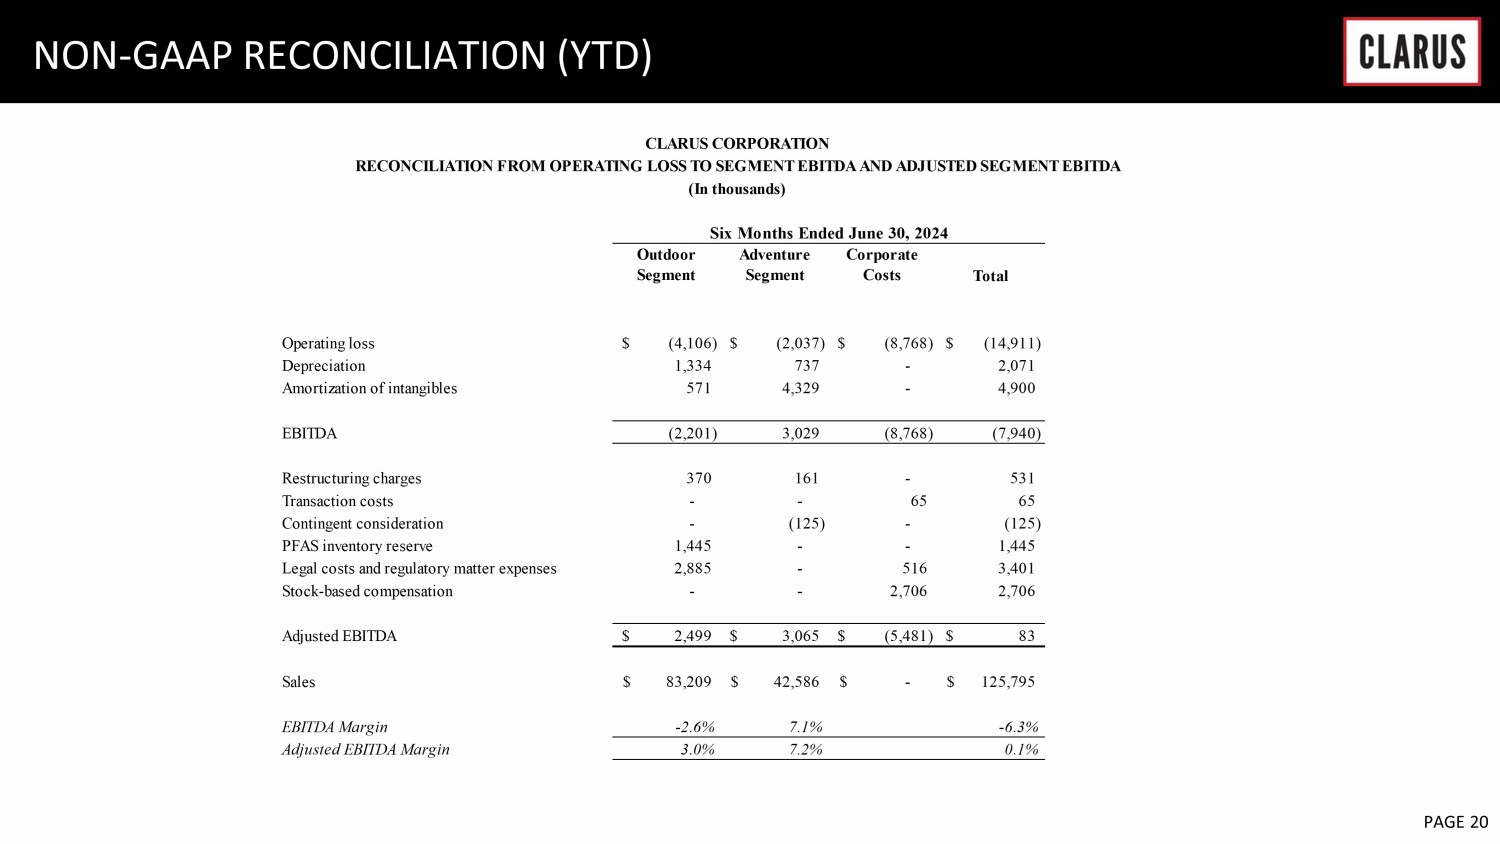
6 February 2023 PAGE 20 NON - GAAP RECONCILIATION (YTD) Outdoor Segment Adventure Segment Corporate Costs Total Operating loss (4,106)$ (2,037)$ (8,768)$ (14,911)$ Depreciation 1,334 737 - 2,071 Amortization of intangibles 571 4,329 - 4,900 EBITDA (2,201) 3,029 (8,768) (7,940) Restructuring charges 370 161 - 531 Transaction costs - - 65 65 Contingent consideration - (125) - (125) PFAS inventory reserve 1,445 - - 1,445 Legal costs and regulatory matter expenses 2,885 - 516 3,401 Stock-based compensation - - 2,706 2,706 Adjusted EBITDA 2,499$ 3,065$ (5,481)$ 83$ Sales 83,209$ 42,586$ -$ 125,795$ EBITDA Margin -2.6% 7.1% -6.3% Adjusted EBITDA Margin 3.0% 7.2% 0.1% CLARUS CORPORATION RECONCILIATION FROM OPERATING LOSS TO SEGMENT EBITDA AND ADJUSTED SEGMENT EBITDA (In thousands) Six Months Ended June 30, 2024