|
Delaware
|
58-1972600
|
|
(State
of Incorporation)
|
(I.R.S.
Employer Identification No.)
|
|
PAGE
|
||||
|
PART
I
|
||||
|
ITEM
1.
|
BUSINESS
|
1
|
||
|
FORWARD-LOOKING
STATEMENTS
|
1
|
|||
|
OVERVIEW
|
1
|
|||
|
BUSINESS
|
1
|
|||
|
PRIOR
BUSINESS
|
2
|
|||
|
EMPLOYEES
|
3
|
|||
|
AVAILABLE
INFORMATION
|
3
|
|||
|
ITEM
1A.
|
RISK
FACTORS
|
4
|
||
|
ITEM
1B.
|
UNRESOLVED
STAFF COMMENTS
|
10
|
||
|
ITEM
2.
|
PROPERTIES
|
10
|
||
|
ITEM
3.
|
LEGAL
PROCEEDINGS
|
10
|
||
|
ITEM
4.
|
SUBMISSION
OF MATTERS TO A VOTE OF SECURITY HOLDERS
|
10
|
||
|
PART
II
|
||||
|
ITEM
5.
|
MARKET
FOR REGISTRANT’S COMMON EQUITY AND RELATED STOCKHOLDER
MATTERS AND ISSUER PURCHASES OF EQUITY
SECURITIES
|
11
|
||
|
ITEM
6.
|
SELECTED
FINANCIAL DATA
|
14
|
||
|
ITEM
7.
|
MANAGEMENT'S
DISCUSSION AND ANALYSIS OF FINANCIAL CONDITION AND RESULTS OF
OPERATIONS
|
15
|
||
|
ITEM
7A.
|
QUANTITATIVE
AND QUALITATIVE DISCLOSURES ABOUT MARKET RISK
|
22
|
||
|
ITEM
8.
|
FINANCIAL
STATEMENTS AND SUPPLEMENTAL DATA
|
23
|
||
|
ITEM
9.
|
CHANGES
IN AND DISAGREEMENTS WITH ACCOUNTANTS ON ACCOUNTING AND FINANCIAL
DISCLOSURE
|
44
|
||
|
ITEM
9A.
|
CONTROLS
AND PROCEDURES
|
44
|
||
|
ITEM
9B
|
OTHER
INFORMATION
|
44
|
||
|
PART
III
|
||||
|
ITEM
10.
|
DIRECTORS
AND EXECUTIVE OFFICERS OF THE REGISTRANT
|
45
|
||
|
ITEM
11.
|
EXECUTIVE
COMPENSATION
|
45
|
||
|
ITEM
12.
|
SECURITY
OWNERSHIP OF CERTAIN BENEFICIAL OWNERS AND MANAGEMENT
|
45
|
||
|
ITEM
13.
|
CERTAIN
RELATIONSHIPS AND RELATED TRANSACTIONS
|
45
|
||
|
ITEM
14.
|
PRINCIPAL
ACCOUNTANT FEES AND SERVICES
|
45
|
||
|
PART
IV
|
||||
|
ITEM
15.
|
EXHIBITS,
FINANCIAL STATEMENT SCHEDULES
|
46
|
||
|
SIGNATURES
|
49
|
|||
|
EXHIBIT
INDEX
|
52
|
|||
|
High
|
Low
|
|||||||
|
Calendar
Year 2009
|
||||||||
|
First
Quarter (through February 24, 2009)
|
$ | 4.34 | $ | 4.03 | ||||
|
Year
ended December 31, 2008
|
||||||||
|
First
Quarter
|
$ | 6.47 | $ | 5.60 | ||||
|
Second
Quarter
|
$ | 6.42 | $ | 5.55 | ||||
|
Third
Quarter
|
$ | 5.85 | $ | 5.01 | ||||
|
Fourth
Quarter
|
$ | 5.20 | $ | 4.02 | ||||
|
Year
ended December 31, 2007
|
||||||||
|
First
Quarter
|
$ | 8.20 | $ | 7.05 | ||||
|
Second
Quarter
|
$ | 9.80 | $ | 8.05 | ||||
|
Third
Quarter
|
$ | 9.85 | $ | 6.75 | ||||
|
Fourth
Quarter
|
$ | 7.30 | $ | 5.73 | ||||
|
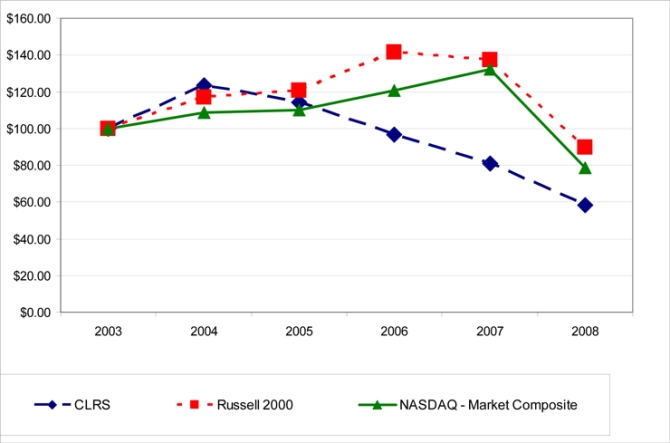
12/31/03
|
12/31/04
|
12/31/05
|
12/31/06
|
12/31/07
|
12/31/08
|
|||||||||||||||||||
|
CLARUS
CORPORATION
|
$ | 100.00 | $ | 123.29 | $ | 114.38 | $ | 96.58 | $ | 80.82 | $ | 58.22 | ||||||||||||
|
NASDAQ
NATIONAL MARKET
COMPOSITE
|
$ | 100.00 | $ | 108.59 | $ | 110.09 | $ | 120.56 | $ | 132.39 | $ | 78.72 | ||||||||||||
|
THE
RUSSELL 2000 INDEX
|
$ | 100.00 | $ | 117.00 | $ | 120.88 | $ | 141.43 | $ | 137.55 | $ | 89.68 | ||||||||||||
|
Plan Category
|
(A)
Number of
securities to be
issued upon
exercise of
outstanding
options, warrants
and rights
|
(B)
Weighted-
Average exercise
price of
outstanding
options, warrants
and rights
|
(C)
Number of securities remaining
available for future issuance under
equity compensation plans
(excluding securities reflected in
column (A))
|
|||||||||
|
Equity
compensation plans approved by security holders (1)
|
1,308,750 | $ | 5.25 | 4,406,517 | ||||||||
|
Equity
compensation plans not approved by security holders (2) (3)
(4)
|
1,100,000 | $ | 7.83 | — | ||||||||
|
Total
|
2,408,750 | $ | 6.42 | 4,406,517 | ||||||||
|
Years ended December 31,
|
||||||||||||||||||||
|
2008
|
2007
|
2006
|
2005
|
2004
|
||||||||||||||||
|
(in
thousands, except per share data)
|
||||||||||||||||||||
|
Statement of Operations
Data:
|
||||||||||||||||||||
|
Revenues:
|
||||||||||||||||||||
|
License
fees
|
$ | — | $ | — | $ | — | $ | — | $ | 1,106 | ||||||||||
|
Total
Revenues
|
— | — | — | — | 1,106 | |||||||||||||||
|
Operating
expenses:
|
||||||||||||||||||||
|
General
and administrative
|
4,517 | 3,767 | 3,530 | 3,504 | 3,395 | |||||||||||||||
|
Transaction
expense
|
— | (13 | ) | 1,431 | (59 | ) | 1,636 | |||||||||||||
|
Depreciation
|
356 | 359 | 346 | 334 | 186 | |||||||||||||||
|
Total
Operating Expenses
|
4,873 | 4,113 | 5,307 | 3,779 | 5,217 | |||||||||||||||
|
Operating
Loss
|
(4,873 | ) | (4,113 | ) | (5,307 | ) | (3,779 | ) | (4,111 | ) | ||||||||||
|
Other
(expense) income
|
(2 | ) | (6 | ) | — | (2 | ) | 19 | ||||||||||||
|
Interest
income
|
2,473 | 4,239 | 4,016 | 2,490 | 1,203 | |||||||||||||||
|
Net
(Loss) Income Before Income Tax
|
$ | (2,402 | ) | $ | 120 | $ | (1,291 | ) | $ | (1,291 | ) | $ | (2,889 | ) | ||||||
|
Income
tax
|
— | 3 | — | — | — | |||||||||||||||
|
Net
(Loss) Income
|
$ | (2,402 | ) | $ | 117 | $ | (1,291 | ) | $ | (1,291 | ) | $ | (2,889 | ) | ||||||
|
(Loss)
Income Per Share
|
||||||||||||||||||||
|
Basic
|
$ | (0.14 | ) | $ | 0.01 | $ | (0.08 | ) | $ | (0.08 | ) | $ | (0.18 | ) | ||||||
|
Diluted
|
$ | (0.14 | ) | $ | 0.01 | $ | (0.08 | ) | $ | (0.08 | ) | $ | (0.18 | ) | ||||||
|
Weighted
Average Common Shares Outstanding
|
||||||||||||||||||||
|
Basic
|
16,867 | 16,658 | 16,613 | 16,329 | 16,092 | |||||||||||||||
|
Diluted
|
16,867 | 17,051 | 16,613 | 16,329 | 16,092 | |||||||||||||||
|
Balance Sheet Data:
|
As of December 31,
|
|||||||||||||||||||
|
2008
|
2007
|
2006
|
2005
|
2004
|
||||||||||||||||
|
Cash
and cash equivalents
|
$ | 19,342 | $ | 41,886 | $ | 1,731 | $ | 23,270 | $ | 48,377 | ||||||||||
|
Marketable
securities
|
$ | 66,670 | $ | 45,223 | $ | 82,634 | $ | 61,601 | $ | 35,119 | ||||||||||
| $ | 87,177 | $ | 88,680 | $ | 86,673 | $ | 88,278 | $ | 86,437 | |||||||||||
|
Total
stockholders' equity
|
$ | 86,384 | $ | 87,719 | $ | 85,716 | $ | 86,609 | $ | 84,854 | ||||||||||
|
Options Vesting Period
|
1 year
|
|||
|
Dividend
Yield
|
0.00 | % | ||
|
Expected
volatility
|
28.95 | % | ||
|
Risk-free
interest rate
|
2.98 | % | ||
|
Expected
life
|
5.31 years
|
|||
|
Weighted
average fair value
|
$ | 1.61 | ||
|
Options Vesting Period
|
1 year
|
4 years
|
||||||
|
Dividend
Yield
|
0.00 | % | 0.00 | % | ||||
|
Expected
volatility
|
31.8 | % | 40.9 | % | ||||
|
Risk-free
interest rate
|
3.54 | % | 3.80 | % | ||||
|
Expected
life
|
5.75 years
|
6.25 years
|
||||||
|
Weighted
average fair value
|
$ | 2.22 | $ | 2.77 | ||||
|
Net Operating
Loss
|
||||
|
Expiration Dates
December 31
|
Amount
(000’s)
|
|||
|
2009
|
$ | 1,900 | ||
|
2010
|
7,417 | |||
|
2011
|
7,520 | |||
|
2012
|
5,157 | |||
|
2020
|
29,533 | |||
|
2021
|
50,430 | |||
|
2022
|
115,000 | |||
|
2023
|
5,712 | |||
|
2024
|
3,566 | |||
|
2025
|
1,707 | |||
|
2026
|
476 | |||
|
2028
|
1,372 | |||
|
Total
|
229,790 | |||
|
Section
382 limitation
|
(4,428 | ) | ||
|
After
Limitations
|
$ | 225,362 | ||
|
Contractual Obligations
|
||||||||||||||||||||
|
(in thousands)
|
Payment Due By Period
|
|||||||||||||||||||
|
Less Than
|
More Than
|
|||||||||||||||||||
|
Total
|
1 Year
|
1-3 Years
|
3-5 Years
|
5 Years
|
||||||||||||||||
|
Operating
Lease Obligations
|
$ | 2,005 | $ | 426 | $ | 1,579 | $ | — | $ | — | ||||||||||
|
Total
|
$ | 2,005 | $ | 426 | $ | 1,579 | $ | — | $ | — | ||||||||||
|
2008
|
||||||||||||||||
|
First
|
Second
|
Third
|
Fourth
|
|||||||||||||
|
Quarter
|
Quarter
|
Quarter
|
Quarter
|
|||||||||||||
|
Revenues
|
$ | — | $ | — | $ | — | $ | — | ||||||||
|
Operating
loss
|
$ | (1,239 | ) | $ | (1,342 | ) | $ | (1,249 | ) | $ | (1,043 | ) | ||||
|
Net
(loss) income before taxes
|
$ | (417 | ) | $ | (783 | ) | $ | (715 | ) | $ | (487 | ) | ||||
|
Net
(loss) income
|
$ | (417 | ) | $ | (783 | ) | $ | (715 | ) | $ | (487 | ) | ||||
|
Net
(loss) income per share:
|
||||||||||||||||
|
Basic
|
$ | (0.02 | ) | $ | (0.05 | ) | $ | (0.04 | ) | $ | (0.03 | ) | ||||
|
Diluted
|
$ | (0.02 | ) | $ | (0.05 | ) | $ | (0.04 | ) | $ | (0.03 | ) | ||||
|
2007
|
||||||||||||||||
|
First
|
Second
|
Third
|
Fourth
|
|||||||||||||
|
Quarter
|
Quarter
|
Quarter
|
Quarter
|
|||||||||||||
|
Revenues
|
$ | — | $ | — | $ | — | $ | — | ||||||||
|
Operating
loss
|
$ | ( 874 | ) | $ | ( 998 | ) | $ | (1,050 | ) | $ | (1,191 | ) | ||||
|
Net
income (loss) before taxes
|
$ | 202 | $ | 81 | $ | 36 | $ | (199 | ) | |||||||
|
Net
income (loss)
|
$ | 202 | $ | 81 | $ | 36 | $ | (202 | ) | |||||||
|
Net
income (loss) per share:
|
||||||||||||||||
|
Basic
|
$ | 0.01 | $ | 0.00 | $ | 0.00 | $ | (0.01 | ) | |||||||
|
Diluted
|
$ | 0.01 | $ | 0.00 | $ | 0.00 | $ | (0.01 | ) | |||||||
|
Page
|
||
|
Report
of Independent Registered Public Accounting Firm on Consolidated Financial
Statements and Internal Control Over Financial Reporting
|
24
|
|
|
Consolidated
Balance Sheets -December 31, 2008 and 2007
|
25
|
|
|
Consolidated
Statements of Operations -Years Ended December 31, 2008, 2007 and
2006
|
26
|
|
|
Consolidated
Statements of Stockholders' Equity and Comprehensive Loss -Years Ended
December 31, 2008, 2007 and 2006
|
27
|
|
|
Consolidated
Statements of Cash Flows -Years Ended December 31, 2008, 2007 and
2006
|
29
|
|
|
Notes
to Consolidated Financial Statements
|
30
|
|
/s/ KPMG LLP
|
|
|
Stamford,
Connecticut
|
|
|
March
3, 2009
|
|
|
2008
|
2007
|
|||||||
|
ASSETS
|
||||||||
|
CURRENT
ASSETS:
|
||||||||
|
Cash
and cash equivalents
|
$ | 19,342 | $ | 41,886 | ||||
|
Marketable
securities
|
66,670 | 45,223 | ||||||
|
Interest
receivable
|
24 | 15 | ||||||
|
Prepaids
and other current assets
|
109 | 175 | ||||||
|
Total
current assets
|
86,145 | 87,299 | ||||||
|
PROPERTY
AND EQUIPMENT, NET
|
1,032 | 1,381 | ||||||
|
Total
assets
|
$ | 87,177 | $ | 88,680 | ||||
|
LIABILITIES
AND STOCKHOLDERS' EQUITY
|
||||||||
|
CURRENT
LIABILITIES:
|
||||||||
|
Accounts
payable and accrued liabilities
|
$ | 383 | $ | 618 | ||||
|
Total
current liabilities
|
383 | 618 | ||||||
|
Deferred
rent
|
410 | 343 | ||||||
|
Total
liabilities
|
793 | 961 | ||||||
|
COMMITMENTS
AND CONTINGENCIES (Note 7)
|
||||||||
|
STOCKHOLDERS'
EQUITY:
|
||||||||
|
Preferred
stock, $.0001 par value; 5,000,000 shares authorized; none
issued
|
— | — | ||||||
|
Common
stock, $.0001 par value; 100,000,000 shares authorized;
|
||||||||
|
17,441,747
and 17,441,747 shares issued; and 17,366,747 and
17,366,747
|
||||||||
|
outstanding
in 2008 and 2007, respectively
|
2 | 2 | ||||||
|
Additional
paid-in capital
|
370,504 | 369,827 | ||||||
|
Accumulated
deficit
|
(284,523 | ) | (282,121 | ) | ||||
|
Less
treasury stock, 75,000 shares at cost
|
(2 | ) | (2 | ) | ||||
|
Accumulated
other comprehensive income
|
403 | 13 | ||||||
|
Total
stockholders' equity
|
86,384 | 87,719 | ||||||
|
Total
liabilities and stockholders' equity
|
$ | 87,177 | $ | 88,680 | ||||
|
2008
|
2007
|
2006
|
||||||||||
|
REVENUES:
|
||||||||||||
|
Total
revenues
|
$ | — | $ | — | $ | — | ||||||
|
OPERATING
EXPENSES:
|
||||||||||||
|
General
and administrative
|
4,517 | 3,767 | 3,530 | |||||||||
|
Transaction
expense
|
— | (13 | ) | 1,431 | ||||||||
|
Depreciation
|
356 | 359 | 346 | |||||||||
|
Total
operating expenses
|
4,873 | 4,113 | 5,307 | |||||||||
|
OPERATING
LOSS
|
(4,873 | ) | (4,113 | ) | (5,307 | ) | ||||||
|
OTHER
EXPENSE
|
(2 | ) | (6 | ) | — | |||||||
|
INTEREST
INCOME
|
2,473 | 4,239 | 4,016 | |||||||||
|
NET
(LOSS) INCOME BEFORE TAXES
|
(2,402 | ) | 120 | (1,291 | ) | |||||||
|
INCOME
TAXES
|
— | 3 | — | |||||||||
|
NET
(LOSS) INCOME
|
$ | (2,402 | ) | $ | 117 | $ | (1,291 | ) | ||||
|
NET
(LOSS) INCOME PER SHARE
|
||||||||||||
|
Basic
|
$ | (0.14 | ) | $ | 0.01 | $ | (0.08 | ) | ||||
|
Diluted
|
$ | (0.14 | ) | $ | 0.01 | $ | (0.08 | ) | ||||
|
WEIGHTED
AVERAGE COMMON SHARES OUTSTANDING
|
||||||||||||
|
Basic
|
16,867 | 16,658 | 16,613 | |||||||||
|
Diluted
|
16,867 | 17,051 | 16,613 | |||||||||
|
Accumulated
|
||||||||||||||||||||||||||||
|
Additional
|
Treasury
|
Other
|
||||||||||||||||||||||||||
|
Common Stock
|
Paid-In
|
Accumulated
|
Stock
|
Comprehensive
|
||||||||||||||||||||||||
|
Shares
|
Amount
|
Capital
|
Deficit
|
Shares
|
Amount
|
Income (loss)
|
||||||||||||||||||||||
|
BALANCES,
December 31, 2005
|
17,187 | $ | 2 | $ | 370,704 | $ | (280,947 | ) | (75 | ) | $ | (2 | ) | $ | (88 | ) | ||||||||||||
|
Exercise
of stock options
|
— | — | — | — | — | — | — | |||||||||||||||||||||
|
Issuance
of restricted shares, net of amortization
|
1 | — | 301 | — | — | — | — | |||||||||||||||||||||
|
Net
loss
|
— | — | — | (1,291 | ) | — | — | — | ||||||||||||||||||||
|
Reclassification
of deferred compensation upon adoption of SFAS No. 123R as of
January 1, 2006
|
— | — | (3,060 | ) | — | — | — | — | ||||||||||||||||||||
|
Increase
in unrealized gain on marketable securities
|
— | — | — | — | — | — | 97 | |||||||||||||||||||||
|
BALANCES,
December 31, 2006
|
17,188 | 2 | 367,945 | (282,238 | ) | (75 | ) | (2 | ) | 9 | ||||||||||||||||||
|
Exercise
of stock options
|
247 | — | 1,438 | — | — | — | — | |||||||||||||||||||||
|
Issuance
of restricted shares, net of amortization
|
7 | — | 444 | — | — | — | — | |||||||||||||||||||||
|
Net
income
|
— | — | — | 117 | — | — | — | |||||||||||||||||||||
|
Increase
in unrealized gain on marketable securities
|
— | — | — | — | — | — | 4 | |||||||||||||||||||||
|
BALANCES,
December 31, 2007
|
17,442 | 2 | 369,827 | (282,121 | ) | (75 | ) | (2 | ) | 13 | ||||||||||||||||||
|
Exercise
of stock options
|
— | — | — | — | — | — | — | |||||||||||||||||||||
|
Equity
compensation
|
— | — | 677 | — | — | — | — | |||||||||||||||||||||
|
Net
loss
|
— | — | — | (2,402 | ) | — | — | — | ||||||||||||||||||||
|
Increase
in unrealized gain on marketable securities
|
— | — | — | — | — | — | 390 | |||||||||||||||||||||
|
BALANCES,
December 31, 2008
|
17,442 | $ | 2 | $ | 370,504 | $ | (284,523 | ) | (75 | ) | $ | (2 | ) | $ | 403 | |||||||||||||
|
Deferred
|
Total
Stockholders'
|
Comprehensive
|
||||||||||
|
Compensation
|
Equity
|
Loss
|
||||||||||
|
BALANCES,
December 31, 2005
|
$ | (3,060 | ) | $ | 86,609 | $ | — | |||||
|
Exercise
of stock options
|
— | — | — | |||||||||
|
Issuance
of restricted shares, net of amortization
|
— | 301 | — | |||||||||
|
Net
loss
|
— | (1,291 | ) | (1,291 | ) | |||||||
|
Reclassification
of deferred compensation upon the adoption of SFAS No. 123R as of January
1, 2006
|
3,060 | — | — | |||||||||
|
Increase
in unrealized gain on marketable securities
|
— | 97 | 97 | |||||||||
|
Total
comprehensive loss
|
$ | (1,194 | ) | |||||||||
|
BALANCES,
December 31, 2006
|
— | 85,716 | — | |||||||||
|
Exercise
of stock options
|
— | 1,438 | — | |||||||||
|
Issuance
of restricted shares, net of amortization
|
— | 444 | — | |||||||||
|
Net
income.
|
— | 117 | 117 | |||||||||
|
Increase
in unrealized gain on marketable securities
|
— | 4 | 4 | |||||||||
|
Total
comprehensive loss
|
$ | 121 | ||||||||||
|
BALANCES,
December 31, 2007
|
— | 87,719 | — | |||||||||
|
Exercise
of stock options
|
— | — | — | |||||||||
|
Equity
compensation
|
— | 677 | — | |||||||||
|
Net
loss.
|
— | (2,402 | ) | (2,402 | ) | |||||||
|
Increase
in unrealized gain on marketable securities
|
— | 390 | 390 | |||||||||
|
Total
comprehensive loss
|
$ | (2,012 | ) | |||||||||
|
BALANCES,
December 31, 2008
|
$ | — | $ | 86,384 | ||||||||
|
2008
|
2007
|
2006
|
||||||||||
|
OPERATING
ACTIVITIES:
|
||||||||||||
|
Net
(loss) income
|
$ | (2,402 | ) | $ | 117 | $ | (1,291 | ) | ||||
|
Adjustments
to reconcile net (loss) income to net cash used in operating
activities:
|
||||||||||||
|
Depreciation
of property and equipment
|
356 | 359 | 346 | |||||||||
|
Amortization
of (discount) and premium on securities, net
|
(1,945 | ) | (2,929 | ) | (2,405 | ) | ||||||
|
Equity
compensation
|
677 | 444 | 301 | |||||||||
|
Changes
in operating assets and liabilities:
|
||||||||||||
|
Decrease/(increase)
in interest receivable, prepaids and other current assets
|
57 | 419 | (154 | ) | ||||||||
|
Decrease
in deposits and other long-term assets
|
— | — | 956 | |||||||||
|
Decrease
in accounts payable and accrued liabilities
|
(235 | ) | (62 | ) | (781 | ) | ||||||
|
Increase
in deferred rent
|
67 | 66 | 69 | |||||||||
|
Net
cash used in operating activities
|
(3,425 | ) | (1,586 | ) | (2,959 | ) | ||||||
|
INVESTING
ACTIVITIES:
|
||||||||||||
|
Purchase
of marketable securities
|
(110,105 | ) | (150,803 | ) | (161,004 | ) | ||||||
|
Proceeds
from the sale and maturity of marketable securities
|
90,993 | 191,147 | 142,473 | |||||||||
|
Purchase
of property and equipment
|
(7 | ) | (48 | ) | (49 | ) | ||||||
|
Disposal
of property and equipment
|
— | 7 | — | |||||||||
|
Net
cash (used in) provided by investing activities
|
(19,119 | ) | 40,303 | (18,580 | ) | |||||||
|
FINANCING
ACTIVITIES:
|
||||||||||||
|
Proceeds
from the exercise of stock options
|
— | 1,438 | — | |||||||||
|
Net
cash provided by financing activities
|
— | 1,438 | — | |||||||||
|
CHANGE
IN CASH AND CASH EQUIVALENTS
|
(22,544 | ) | 40,155 | (21,539 | ) | |||||||
|
CASH
AND CASH EQUIVALENTS, beginning of year
|
41,886 | 1,731 | 23,270 | |||||||||
|
CASH
AND CASH EQUIVALENTS, end of year
|
$ | 19,342 | $ | 41,886 | $ | 1,731 | ||||||
|
SUPPLEMENTAL
DISCLOSURE:
|
||||||||||||
|
Decrease
in transaction expenses included in accounts payable and accrued
liabilities .
|
$ | — | $ | — | $ | (778 | ) | |||||
|
Decrease
in transaction expenses included in other assets
|
$ | — | $ | — | $ | (913 | ) | |||||
|
Cash
paid for franchise and property taxes
|
$ | 458 | $ | 456 | $ | 540 | ||||||
|
Level
1 -
|
Quoted
prices identical instruments in active markets
|
|
Level
2 -
|
Quoted
prices for similar instruments in active markets; quoted prices for
identical or similar instruments in markets that are not active; and
model-derived valuations whose inputs are observable or whose significant
value drivers are observable.
|
|
Level
3 -
|
Significant
inputs to the valuation model are
unobservable.
|
|
December 31,
|
Useful Life
|
|||||||||||
|
2008
|
2007
|
(in years)
|
||||||||||
|
Computers
and equipment
|
$ | 265 | $ | 263 | 1 - 5 | |||||||
|
Furniture
and fixtures
|
488 | 488 | 7 | |||||||||
|
Leasehold
improvements
|
1,893 | 1,893 | 8 | |||||||||
| 2,646 | 2,644 | |||||||||||
|
Less:
accumulated depreciation
|
(1,614 | ) | (1,263 | ) | ||||||||
|
Property
and equipment, net
|
$ | 1,032 | $ | 1,381 | ||||||||
|
2008
|
2007
|
|||||||
|
Accounts
payable
|
$ | 20 | $ | 17 | ||||
|
Accrued
bonuses
|
125 | 220 | ||||||
|
Accrued
professional services
|
156 | 205 | ||||||
|
Accrued
taxes
|
69 | 120 | ||||||
|
Other
|
13 | 56 | ||||||
| $ | 383 | $ | 618 | |||||
|
Options Vesting Period
|
1 year
|
|||
|
Dividend
Yield
|
0.00 | % | ||
|
Expected
volatility
|
28.95 | % | ||
|
Risk-free
interest rate
|
2.98 | % | ||
|
Expected
life
|
5.31 years
|
|||
|
Weighted
average fair value
|
$ | 1.61 | ||
|
Options Vesting Period
|
1 year
|
4 years
|
||||||
|
Dividend
Yield
|
0.00 | % | 0.00 | % | ||||
|
Expected
volatility
|
31.8 | % | 40.9 | % | ||||
|
Risk-free
interest rate
|
3.54 | % | 3.80 | % | ||||
|
Expected
life
|
5.75 years
|
6.25 years
|
||||||
|
Weighted
average fair value
|
$ | 2.22 | $ | 2.77 | ||||
|
2008
|
2007
|
2006
|
||||||||||
|
Weighted
average common shares – basic
|
16,867 | 16,658 | 16,613 | |||||||||
|
Effect
of dilutive stock options
|
— | 148 | — | |||||||||
|
Effect
of dilutive restricted stock
|
— | 245 | — | |||||||||
|
Total
effect of potential incremental shares
|
— | 393 | — | |||||||||
|
Weighted
average common shares – diluted
|
16,867 | 17,051 | 16,613 | |||||||||
|
Net
income (loss) per share:
|
||||||||||||
|
Basic
|
$ | (0.14 | ) | $ | 0.01 | $ | (0.08 | ) | ||||
|
Diluted
|
$ | (0.14 | ) | $ | 0.01 | $ | (0.08 | ) | ||||
|
YEARS
ENDED
|
||||||||||||
|
DECEMBER 31,
|
||||||||||||
|
2008
|
2007
|
2006
|
||||||||||
|
Pre-Tax
Income (loss):
|
||||||||||||
|
Domestic
|
$ | (2,402 | ) | $ | 120 | $ | (1,291 | ) | ||||
|
Foreign
|
— | — | — | |||||||||
| $ | (2,402 | ) | $ | 120 | $ | (1,291 | ) | |||||
|
YEARS
ENDED
|
||||||||||||
|
DECEMBER 31,
|
||||||||||||
|
2008
|
2007
|
2006
|
||||||||||
|
Current:
|
||||||||||||
|
Federal
|
$ | — | $ | 3 | $ | — | ||||||
|
State
|
— | — | — | |||||||||
|
Foreign
|
— | — | — | |||||||||
|
Total
current income for provision
|
$ | — | $ | 3 | $ | — | ||||||
|
YEARS ENDED
|
||||||||||||
|
DECEMBER 31,
|
||||||||||||
|
2008
|
2007
|
2006
|
||||||||||
|
Deferred:
|
||||||||||||
|
Federal
|
(273 | ) | 3,850 | (168 | ) | |||||||
|
State
|
16 | 1,218 | 350 | |||||||||
|
Foreign
|
— | — | — | |||||||||
| (256 | ) | 5,068 | 182 | |||||||||
|
Increase
(decrease) in valuation allowance for deferred income
taxes
|
256 | (5,068 | ) | (182 | ) | |||||||
|
Total
deferred income tax for provision
|
— | — | — | |||||||||
|
Total
income tax provision
|
$ | — | $ | 3 | $ | — | ||||||
|
2008
|
2007
|
2006
|
||||||||||
|
Income
(loss) from operations
|
$ | 256 | $ | (5,068 | ) | $ | (182 | ) | ||||
|
Stockholders’
equity
|
(152 | ) | (1 | ) | (38 | ) | ||||||
|
Total
|
$ | 104 | $ | (5,069 | ) | $ | (220 | ) | ||||
|
YEARS ENDED
DECEMBER 31,
|
||||||||||||
|
2008
|
2007
|
2006
|
||||||||||
|
Computed
"expected" income tax expense (benefit)
|
(34.0 | )% | 34.0 | % | (34.0 | )% | ||||||
|
Increase
(decrease) in income taxes resulting from: State income taxes, net of
federal income taxes
|
(1.6 | ) | 514.4 | (0.5 | ) | |||||||
|
NOL
adjustments
|
2.1 | 152.3 | 18.3 | |||||||||
|
Capital
loss carryforward adjustment
|
22.7 | 3,506.2 | 30.3 | |||||||||
|
Non-cash
stock compensation
|
— | (9.5 | ) | — | ||||||||
|
Other
|
0.2 | 8.2 | — | |||||||||
|
(Decrease)
increase in valuation allowance and other items
|
10.6 | (4,202.8 | ) | (14.1 | ) | |||||||
|
Income
tax expense (benefit)
|
— | % | 2.8 | % | — | % | ||||||
|
YEARS ENDED
DECEMBER 31,
|
||||||||
|
2008
|
2007
|
|||||||
|
Deferred
income tax assets (liabilities):
|
||||||||
|
Net
operating loss, capital loss amount and research &
experimentation credit carryforwards |
$ | 84,830 | $ | 84,970 | ||||
|
Charitable
contribution carryforward
|
5 | 4 | ||||||
|
Depreciation
|
(33 | ) | (139 | ) | ||||
|
Unrealized
gain on marketable securities
|
(157 | ) | (5 | ) | ||||
|
Non-cash
compensation
|
988 | 724 | ||||||
|
Accrued
liabilities
|
159 | 134 | ||||||
|
Reserves
for investments
|
1,728 | 1,728 | ||||||
|
Net
deferred income tax assets before valuation allowance
|
87,520 | 87,416 | ||||||
|
Valuation
allowance for deferred income tax assets
|
(87,520 | ) | (87,416 | ) | ||||
|
Net
deferred income tax assets
|
$ | — | $ | — | ||||
|
Net Operating
Loss
|
||||
|
Expiration Dates
December 31
|
Amount
(000’s)
|
|||
|
2009
|
$ | 1,900 | ||
|
2010
|
7,417 | |||
|
2011
|
7,520 | |||
|
2012
|
5,157 | |||
|
2020
|
29,533 | |||
|
2021
|
50,430 | |||
|
2022
|
115,000 | |||
|
2023
|
5,712 | |||
|
2024
|
3,566 | |||
|
2025
|
1,707 | |||
|
2026
|
476 | |||
|
2028
|
1,372 | |||
|
Total
|
229,790 | |||
|
Section 382 limitation
|
(4,428 | ) | ||
|
After
Limitations
|
$ | 225,362 | ||
|
Options Vesting Period
|
1 year
|
|||
|
Dividend
Yield
|
0.00 | % | ||
|
Expected
volatility
|
28.95 | % | ||
|
Risk-free
interest rate
|
2.98 | % | ||
|
Expected
life
|
5.31
years
|
|||
|
Weighted
average fair value
|
$ | 1.61 | ||
|
Options Vesting Period
|
1 year
|
4 years
|
||||||
|
Dividend
Yield
|
0.00 | % | 0.00 | % | ||||
|
Expected
volatility
|
31.8 | % | 40.9 | % | ||||
|
Risk-free
interest rate
|
3.54 | % | 3.80 | % | ||||
|
Expected
life
|
5.75
years
|
6.25
years
|
||||||
|
Weighted
average fair value
|
$ | 2.22 | $ | 2.77 | ||||
|
Shares
|
Range of
Exercise
Prices
|
Weighted
Average
Exercise
Price
|
||||||||||
|
December
31, 2005
|
1,681,250 | $5.35-$10.00 | $ | 7.36 | ||||||||
|
Granted
|
— | |||||||||||
|
Forfeited
|
— | |||||||||||
|
Expired
|
(7,500 | ) | $5.41 | $ | 5.41 | |||||||
|
Exercised
|
— | |||||||||||
|
December
31, 2006
|
1,673,750 | $5.35-$10.00 | $ | 7.36 | ||||||||
|
Granted
|
430,000 | $5.98 | $ | 5.98 | ||||||||
|
Forfeited
|
(7,757 | ) | $7.40-$8.60 | $ | 8.17 | |||||||
|
Expired
|
— | |||||||||||
|
Exercised
|
(247,243 | ) | $5.35-$8.60 | $ | 5.81 | |||||||
|
December
31, 2007
|
1,848,750 | $5.35-$10.00 | $ | 7.24 | ||||||||
|
Granted
|
60,000 | $5.01 | $ | 5.01 | ||||||||
|
Forfeited
|
— | |||||||||||
|
Expired
|
— | |||||||||||
|
Exercised
|
— | |||||||||||
|
December
31, 2008
|
1,908,750 | $5.01-$10.00 | $ | 7.17 | ||||||||
|
Vested
and exercisable at December 31, 2008
|
1,668,750 | $ | 7.36 | |||||||||
|
Vested
and exercisable at December 31, 2007
|
1,493,750 | $ | 7.54 | |||||||||
|
Vested
and exercisable at December 31, 2006
|
1,673,750 | $ | 7.36 | |||||||||
|
Outstanding
|
Exercisable
|
|||||||||||||||||||
|
Exercise
Price
Range
|
Number
of Shares
Outstanding at
December 31, 2008
|
Weighted
Average
Exercise
Price
|
Weighted
Average
Remaining
Contractual
Life (Years)
|
Number
of Shares
Exercisable at
December 31, 2008
|
Weighted
Average
Exercise
Price
|
|||||||||||||||
|
$
5.01 - $ 5.52
|
450,000 | $ | 4.97 | 6.0 | 420,000 | $ | 5.33 | |||||||||||||
|
$
5.53 - $10.00
|
1,458,750 | $ | 6.89 | 6.6 | 1,248,750 | $ | 8.04 | |||||||||||||
| 1,908,750 | $ | 7.17 | 6.4 | 1,668,750 | $ | 7.36 | ||||||||||||||
|
Gross Rental
|
Sub-Lease
|
|||||||
|
Obligations
|
Income
|
|||||||
|
Year
ending December 31,
|
||||||||
|
2009
|
426 | 106 | ||||||
|
2010
|
451 | 113 | ||||||
|
2011
|
1,128 | 282 | ||||||
|
2012
|
— | — | ||||||
|
2013
|
— | — | ||||||
|
Thereafter
|
— | — | ||||||
|
Total
|
$ | 2,005 | $ | 501 | ||||
|
Page
|
||
|
Report
of Independent Registered Public Accounting Firm on Consolidated Financial
Statements and Internal Control over Financial Reporting
|
24
|
|
|
Consolidated
Balance Sheets - December 31, 2008 and 2007
|
25
|
|
|
Consolidated
Statements of Operations -Years Ended December 31, 2008, 2007 and
2006
|
26
|
|
|
Consolidated
Statements of Stockholders' Equity and Comprehensive Loss -Years Ended
December 31, 2008, 2007 and 2006
|
27
|
|
|
Consolidated
Statements of Cash Flows -Years Ended December 31, 2008, 2007 and
2006
|
29
|
|
|
Notes
to Consolidated Financial Statements
|
30
|
|
|
|
||
|
(2)
The following additional financial statement schedule and report of
independent registered public accounting firm are furnished herewith
pursuant to the requirements of Form 10-K:
|
||
|
Schedule
II Valuation and Qualifying Accounts
|
51
|
|
Exhibit
Number
|
Exhibit
|
|
|
3.1
|
Amended
and Restated Certificate of Incorporation of the Company (incorporated
herein by reference to Exhibit 3.3 of the Company's Form S-1/A
Registration Statement filed with the Securities and Exchange Commission
on April 6, 1998 (File No. 333- 46685)).
|
|
|
3.2
|
Amendment
to Amended and Restated Certificate of Incorporation (incorporated herein
by reference to Exhibit 4.1 of the Company's 10-Q filed with
the Securities and Exchange Commission on August 14,
2000).
|
|
|
3.3
|
Amended
and Restated Certificate of Incorporation of the Company (incorporated
herein by reference to Appendix C of the Company’s Definitive Proxy
Statement filed with the Securities and Exchange Commission on November 6,
2002).
|
|
|
3.4
|
Amendment
to Amended and Restated Certificate of Incorporation of the Company
(incorporated herein by reference to Exhibit 3.1 of the
Company's Current Report on Form 8-K, filed with the Securities and
Exchange Commission on July 31, 2003).
|
|
|
3.5
|
Amended
and Restated Bylaws of the Company (incorporated herein by reference to
Appendix D of the Company's Definitive Proxy Statement filed with the
Securities and Exchange Commission on November 6,
2002).
|
|
|
3.6
|
Amendment
No. 1 to the Amended and Restated Bylaws of the Company. (incorporated
herein by reference to Exhibit 3.4 of the Company's Annual
Report on Form 10-K, filed with the Securities and Exchange Commission on
March 31, 2003).
|
|
|
3.7
|
Form
of Certificate of Designation of Series A Junior Participating Preferred
Stock (incorporated herein by reference to Exhibit 3.1 of the Company's
Form 8-K, filed with the Securities and Exchange Commission on February
13, 2008).
|
|
|
4.1
|
See
Exhibits 3.1, 3.2, 3.3, 3.4 and 3.5 for provisions of the Amended and
Restated Certificate of Incorporation and Amended and Restated
Bylaws of the Company defining rights of the holders of Common Stock of
the Company.
|
|
|
4.2
|
Specimen
Stock Certificate (incorporated herein by reference to Exhibit 4.2 of the
Company's Registration Statement on Form S-1 filed with the
Securities and Exchange Commission on May 26, 1998 (File No.
333-46685)).
|
|
4.3
|
Restricted
Stock Agreement, dated as of April 11, 2003, between the Company and
Warren B. Kanders (incorporated herein by reference to Exhibit
4.1 of the Company's Form 10-Q filed with the Securities and Exchange
Commission on May 15, 2003). *
|
|
|
4.4
|
Rights
Agreement, dated as of February 12, 2008, by and between Clarus
Corporation and American Stock Transfer & Trust Company (incorporated
herein by reference to Exhibit 4.2 of the Company’s Form 8-K filed with
the Securities and Exchange Commission on February 13,
2008).
|
|
|
4.5
|
Form
of Rights Certificate (incorporated herein by reference to Exhibit 4.1 of
the Company’s Form 8-K filed with the Securities and Exchange Commission
on February 13, 2008).
|
|
|
10.7
|
Form
of Indemnification Agreement for Directors and Executive Officers of the
Company (incorporated herein by reference to Exhibit 10.1 of
the Company's Form 8-K filed with the Securities and Exchange Commission
on December 23, 2002).
|
|
|
10.8
|
Employment
Agreement, dated as of December 6, 2002, between the Company and Warren B.
Kanders (incorporated herein by reference to Exhibit 10.2 of
the Company's Form 8-K filed with the Securities and Exchange Commission
on December 23, 2002).*
|
|
|
10.9
|
Amended
and Restated Stock Incentive Plan (incorporated herein by reference to
Exhibit 10.2 of the Company's Form 10-Q filed with the
Securities and Exchange Commission on August 14, 2000).
*
|
|
|
10.10
|
Form
of Nonqualified Stock Option Agreement (incorporated herein by reference
to Exhibit 10.5 of the Company's Form 10- Q filed with the Securities and
Exchange Commission on August 14, 2000). *
|
|
|
10.11
|
Lease,
dated as of September 23, 2003, between Reckson Operating Partnership,
L.P., the Company and Kanders & Company, Inc. (incorporated herein by
reference to Exhibit 10.1 of the Company's 10-Q filed with the Securities
and Exchange Commission on November 12, 2003).
|
|
|
10.12
|
Transportation
Services Agreement, dated as of December 18, 2003, between Kanders
Aviation, LLC and the Company (incorporated herein by reference to Exhibit
10.23 of the Company's 10-K filed with the Securities and Exchange
Commission on March 11, 2004).
|
|
|
10.13
|
Clarus
Corporation 2005 Stock Incentive Plan (incorporated herein by reference to
Appendix A of the Company's Definitive Proxy Statement filed with the
Securities and Exchange Commission on May 2, 2005). *
|
|
|
10.14
|
Form
of Stock Option Agreement for the Clarus Corporation 2005 Stock Incentive
Plan (incorporated herein by reference to Exhibit 10.1 of the
Company's Form 10-Q filed with the Securities and Exchange Commission on
November 3, 2005). *
|
|
|
10.15
|
Amendment
to the form of Stock Option Agreement for the Clarus Corporation 2005
Stock Incentive Plan (incorporated herein by reference to
Exhibit 10.1 of the Company's Form 8-K filed with the Securities and
Exchange Commission on January 6, 2006). *
|
|
|
10.16
|
Stock
Option Agreement, dated December 23, 2002, between the Company and Warren
B. Kanders (incorporated herein by reference to Exhibit 4.6 of the
Company's Registration Statement Form S-8 filed with the Securities and
Exchange Commission on August 18, 2005). *
|
|
|
10.17
|
Extension
Agreement, dated as of May 1, 2006, to the Employment Agreement, dated as
of December 6, 2002, between the Company and Warren B. Kanders
(incorporated herein by reference to Exhibit 10.2 of the Company’s Form
8-K filed with the Securities and Exchange Commission on May 4,
2006).*
|
|
|
10.18
|
Resignation
and Severance Agreement and General Release, dated as of December 11,
2006, between the Company and Nigel P. Ekern (incorporated herein by
reference to Exhibit 10.1 of the Company’s Form 8-K filed with the
Securities and Exchange Commission on December 12,
2006).*
|
|
|
23.1
|
Consent
of Independent Registered Public Accounting Firm.**
|
|
|
31.1
|
Certification
of Principal Executive Officer, as required by Rule 13a-14(a) of the
Securities Exchange Act of 1934.**
|
|
|
31.2
|
Certification
of Principal Financial Officer, as required by Rule 13a-14(a) of the
Securities Exchange Act of
1934.**
|
|
32.1
|
Certification
of Principal Executive Officer, as required by Rule 13a-14(b) of the
Securities Exchange Act of 1934.**
|
|
|
32.2
|
Certification
of Principal Financial Officer, as required by Rule 13a-14(b) of the
Securities Exchange Act of
1934.**
|
|
|
*
|
Management
contract or compensatory plan or
arrangement.
|
|
|
**
|
Filed
herewith
|
|
Date: March
3, 2009
|
|||
|
By:
|
/s/ Philip A. Baratelli
|
||
| Philip A. Baratelli | |||
| Chief Financial Officer | |||
|
Signature
|
Title
|
Date
|
||
|
/s/ Warren B. Kanders
|
Executive
Chairman of the
|
March 3,
2009
|
||
|
Warren
B. Kanders
|
Board
of Directors
|
|||
|
(principal
executive officer)
|
||||
|
/s/ Philip A. Baratelli
|
Chief
Financial Officer
|
March 3,
2009
|
||
|
Philip
A. Baratelli
|
(principal
financial officer)
|
|||
|
/s/ Donald L. House
|
Director
|
March 3,
2009
|
||
|
Donald
L. House
|
||||
|
/s/ Burtt R. Ehrlich
|
Director
|
March 3,
2009
|
||
|
Burtt
R. Ehrlich
|
||||
|
/s/ Nicholas Sokolow
|
Director
|
March 3,
2009
|
||
|
Nicholas
Sokolow
|
|
/s/ KPMG LLP
|
|
Stamford,
Connecticut
|
|
March 3,
2009
|
|
Balance at
Beginning of
Period
|
Charged
(Credited) to
Costs and
Expenses
|
Deductions (a) (b)
|
Balance at
End of
Period
|
|||||||||||||
|
Valuation
Allowance for Deferred Income Tax Assets
|
||||||||||||||||
|
2006
|
$ | 92,705,000 | $ | (220,000 | ) | $ | — | $ | 92,485,000 | |||||||
|
2007
|
92,485,000 | (5,069,000 | ) | — | 87,416,000 | |||||||||||
|
2008
|
$ | 87,416,000 | $ | 256,000 | $ | (152,000 | ) | $ | 87,520,000 | |||||||
|
Restructuring
Accruals
|
||||||||||||||||
|
2006
|
$ | 17,000 | — | $ | (17,000 | ) | — | |||||||||
|
(a)
|
Deductions
related to restructuring and related accruals represent cash
payments.
|
|
(b)
|
Deduction
related to valuation allowance for deferred income tax assets represents
decrease in valuation allowance credited to stockholders’
equity.
|
|
Number
|
Exhibit
|
|
|
23.1
|
Consent
of Independent Registered Public Accounting Firm.
|
|
|
31.1
|
Certification
of Principal Executive Officer, as required by Rule 13a-14(a) of the
Securities Exchange Act of 1934.
|
|
|
31.2
|
Certification
of Principal Financial Officer, as required by Rule 13a-14(a) of the
Securities Exchange Act of 1934.
|
|
|
32.1
|
Certification
of Principal Executive Officer, as required by Rule 13a-14(b) of the
Securities Exchange Act of 1934.
|
|
|
32.2
|
Certification
of Principal Financial Officer, as required by Rule 13a-14(b) of the
Securities Exchange Act of
1934
|